Scales and Intervals in Graphs
Scales and Intervals in Graphs
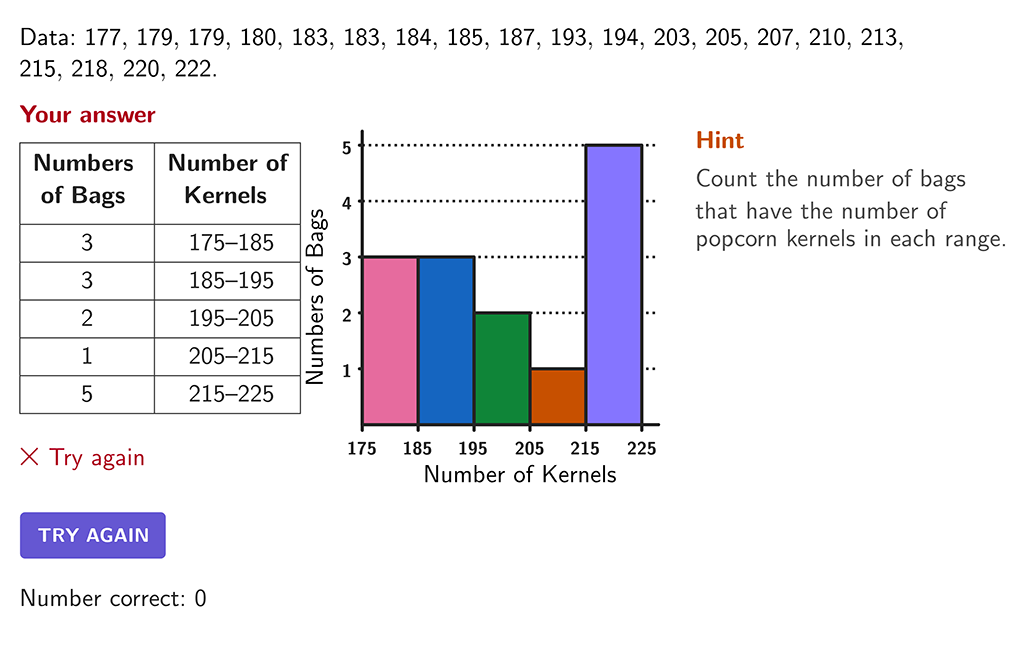
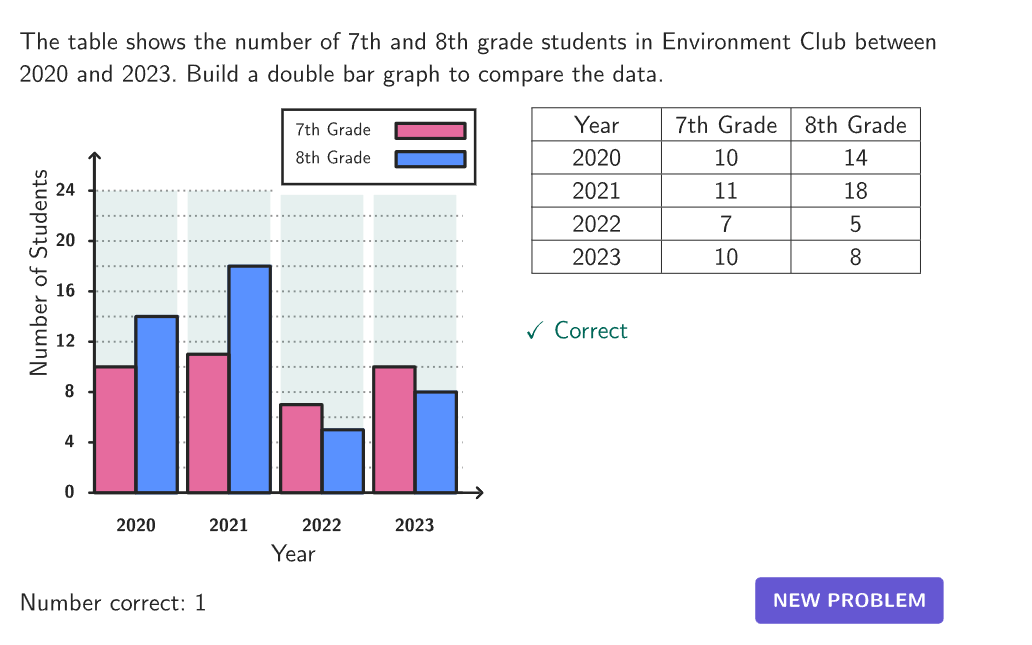
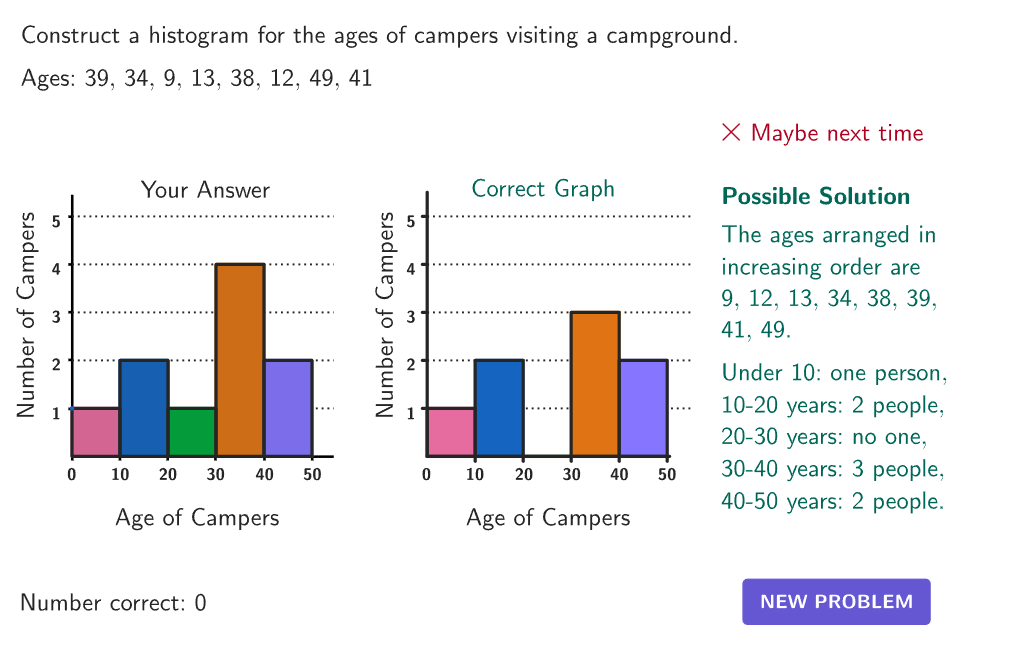
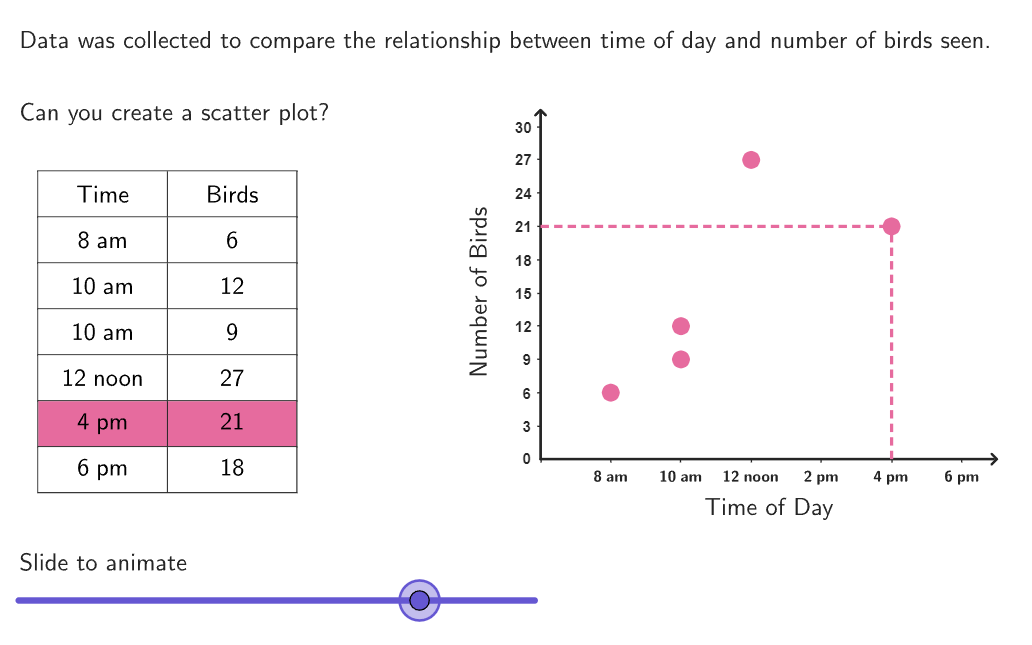
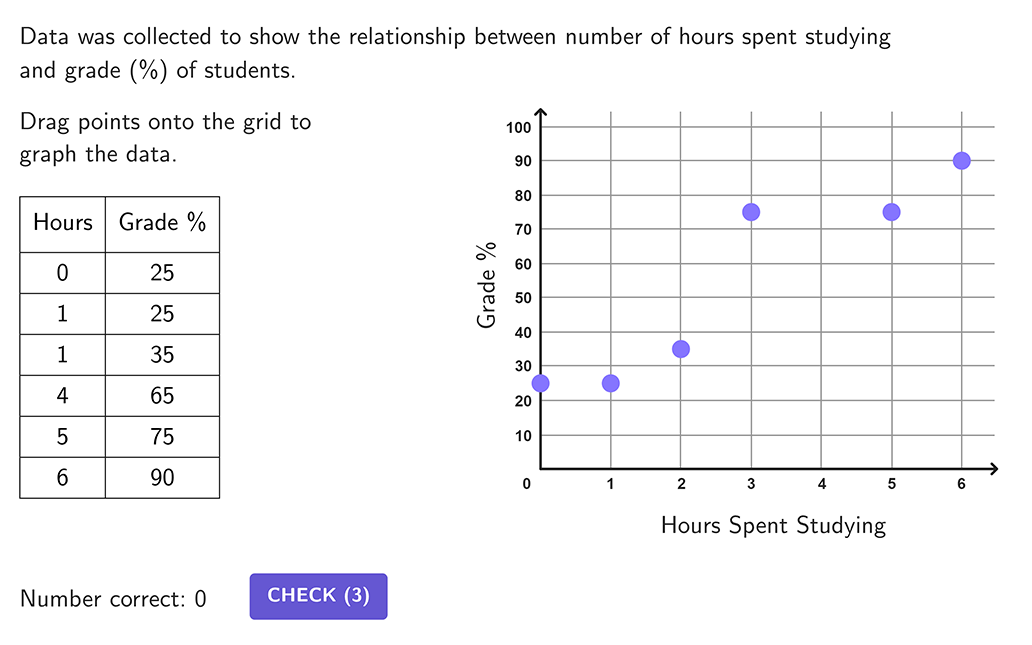
Scale the axes of a coordinate plane to fit a set of points. Zoom in and out to display the data trends.
Putting It All Together
Answer these open ended questions on your own or with others to form deeper math connections.
Open-ended question 1
Does the scaling of the and -axis always have to be the same?
Text and math input
Open-ended question 2
Why would it be useful to have different increments marked along the -axis and -axis?
Text and math input
Explore more
Prerequisite Resources
More from Diagrams
Next Resources


