Graphing the Trigonometric Functions (Sine Function)
Activity 1
Change the value of "a" using the slider!
1. Change the value of "a" to 2 and 3, describe how the graph is change.
2. Change the value of "a" to 1/2, describe how the graph is change.
3. Change the value of "a" to -1, describe how the graph is change.
4. Describe the changes that occur on the graph if the value of "a" is changed.
Change the value of "b" using the slider!
5. Change the value of "b" to 2 and 3, describe how the graph is change.
6. Change the value of "b" to 1/2 and 3, describe how the graph is change.
7. Describe the changes that occur on the graph if the value of "b" is changed.
Change the value of "c" using the slider!
8. Increase the value of "c" by moving the slider to the right, what changes have occurred to the graph?
9. Decrease the value of "c" by moving the slider to the left, what changes have occurred to the graph?
10. Describe the changes that occur on the graph if the value of "c" is changed.
Change the value of "d" using the slider!
11. Describe the changes that occur on the graph if the value of "d" is changed.
Conclusion
12. Is there any relationship between the change of a, b, c or d and the period, amplitude, maximum and minimum value of the sine graph? Describe the relationship(s) if any.
Activity 2
Question 1
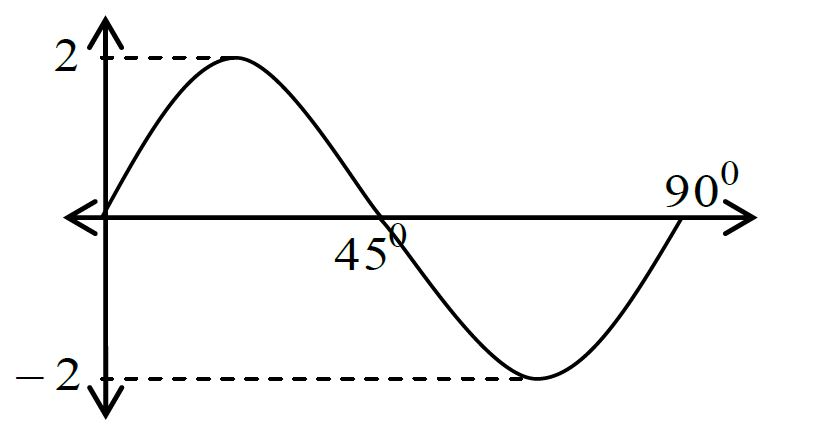
1. Please observe the graph y = k sin ax on the Question 1. The value of k and a for this graph are ….
Question 2
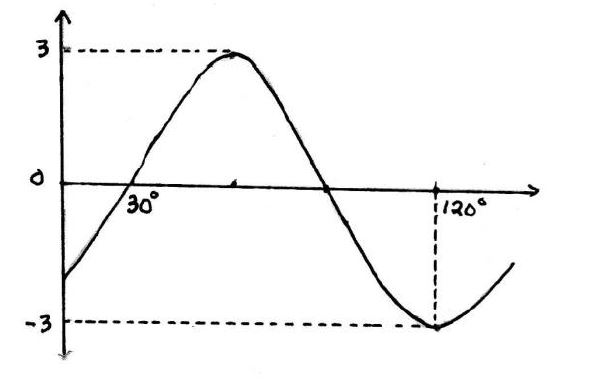
2. The function shown in the graph is ....
Quetion 3
Explain your strategy in solve the Question 2!