Google Classroom
Google Classroom
GeoGebra
GeoGebra Ders
Giriş yap
Ara
Google Classroom
Google Classroom
GeoGebra
GeoGebra Ders
Bölüm taslağı
Graphs and Mapping Diagrams
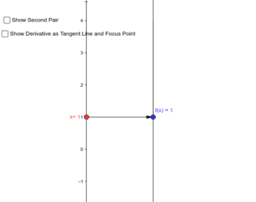
Graph of a function RP1 -> RP1
3 Dimensional Mapping Diagram for z= f(x,y)
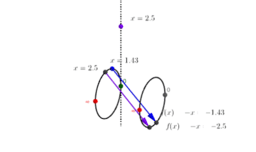
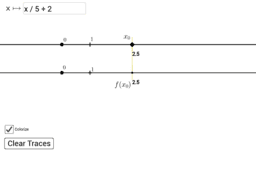
Mapping Diagram of Function : RP1 to RP1
3D Mapping Diagram for linear z=f(x,y) with focus point
Graph w/ Mapping diagram: Estimating The Derivative
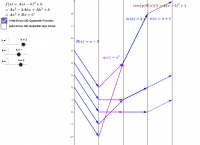
Mapping Diagrams (Real) Visualize Solving a Quadratic Equation
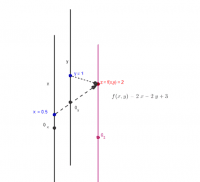
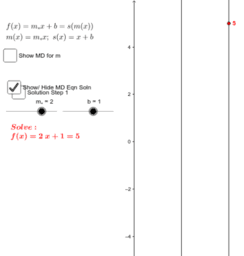
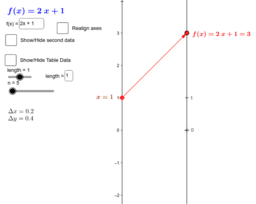
Mapping Diagrams To Visualize Solving a Linear Equation
Mapping Diagrams To Visualize Solving a Linear Equation
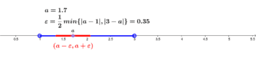
(a,b) is an open interval
Mapping Diagram, Spreadsheet, Graph, Realign, Focus
Visualizing Numeric Transformations
Graphs and Mapping Diagrams
Yazar:
Martin Flashman
Visualizing Functions with Mapping Diagrams and Graphs. Functions defined on R and RP1=S1, the circle.
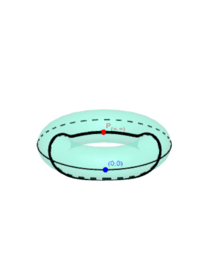
Graph of a function RP1 -> RP1
3 Dimensional Mapping Diagram for z= f(x,y)
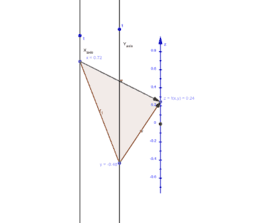
Mapping Diagram of Function : RP1 to RP1
3D Mapping Diagram for linear z=f(x,y) with focus point
Graph w/ Mapping diagram: Estimating The Derivative
Mapping Diagrams (Real) Visualize Solving a Quadratic Equation
Mapping Diagrams To Visualize Solving a Linear Equation
Mapping Diagrams To Visualize Solving a Linear Equation
(a,b) is an open interval
Mapping Diagram, Spreadsheet, Graph, Realign, Focus
Visualizing Numeric Transformations
Sonraki
Graph of a function RP1 -> RP1
Yeni Kaynaklar
အခြေခံ data အခေါ်အဝေါ်များ
Trefoil Knot
Nikmati Keunggulan Di Bandar Judi Terpercaya
Slope Between 2 Points (Phase 2)
Fourier Lissajous (Mechanical)
Kaynakları Keşfet
Radical Functions
copy_style
Untitled
flona2mtask1
ISOSCELES TRIANGLE
Funky Graph
Konuları Keşfet
Tam Sayılar
Parametrik Eğriler
Yüzey
Cebir
Alan