Anmelden
Suche
GeoGebra
Startseite
Materialien
Profil
Classroom
Apps herunterladen
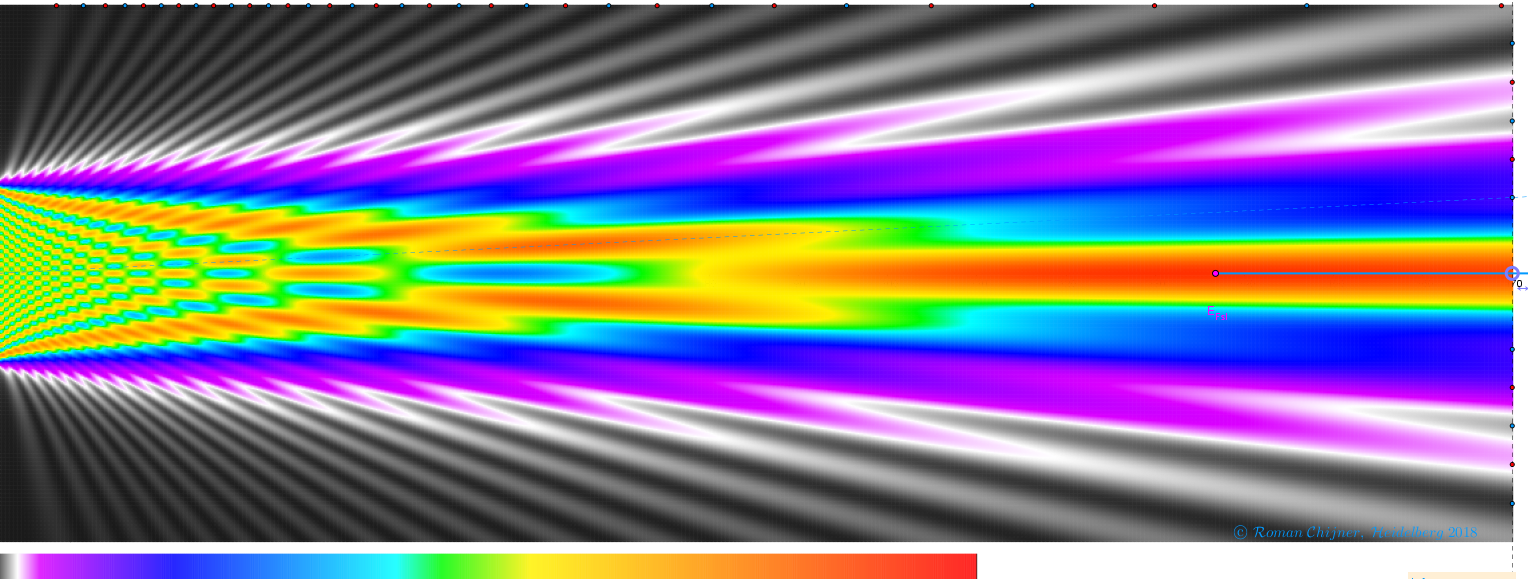
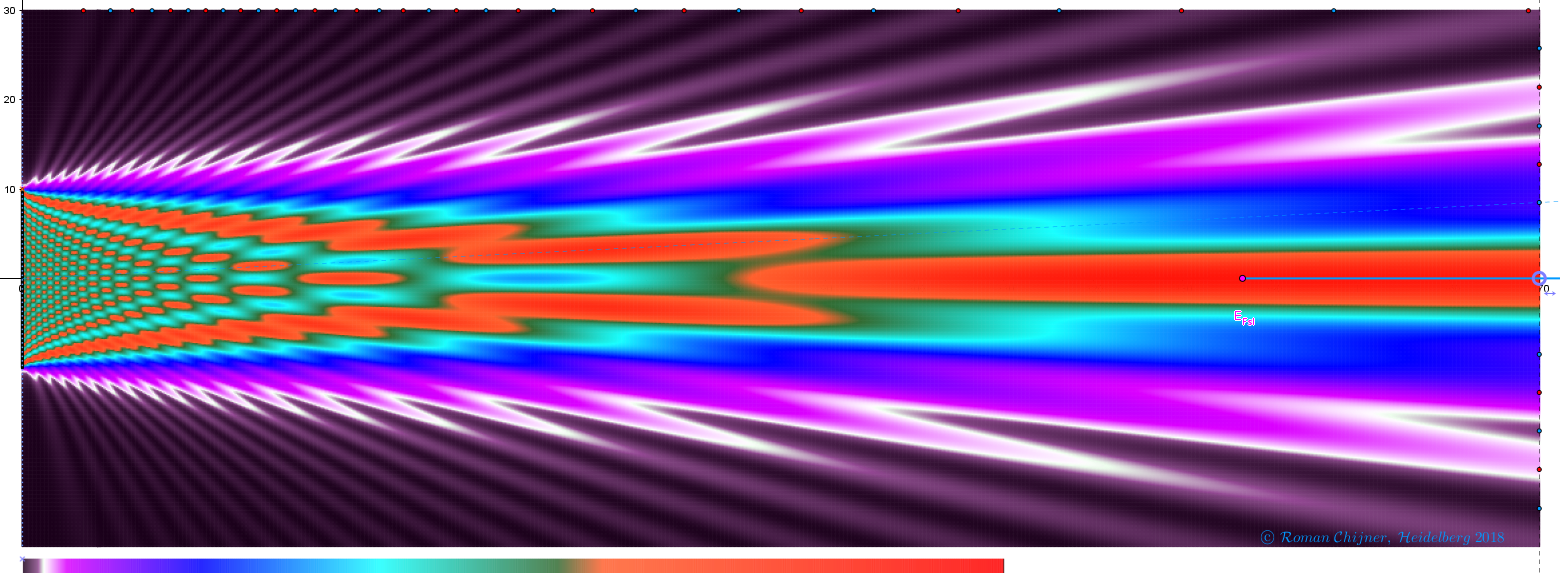
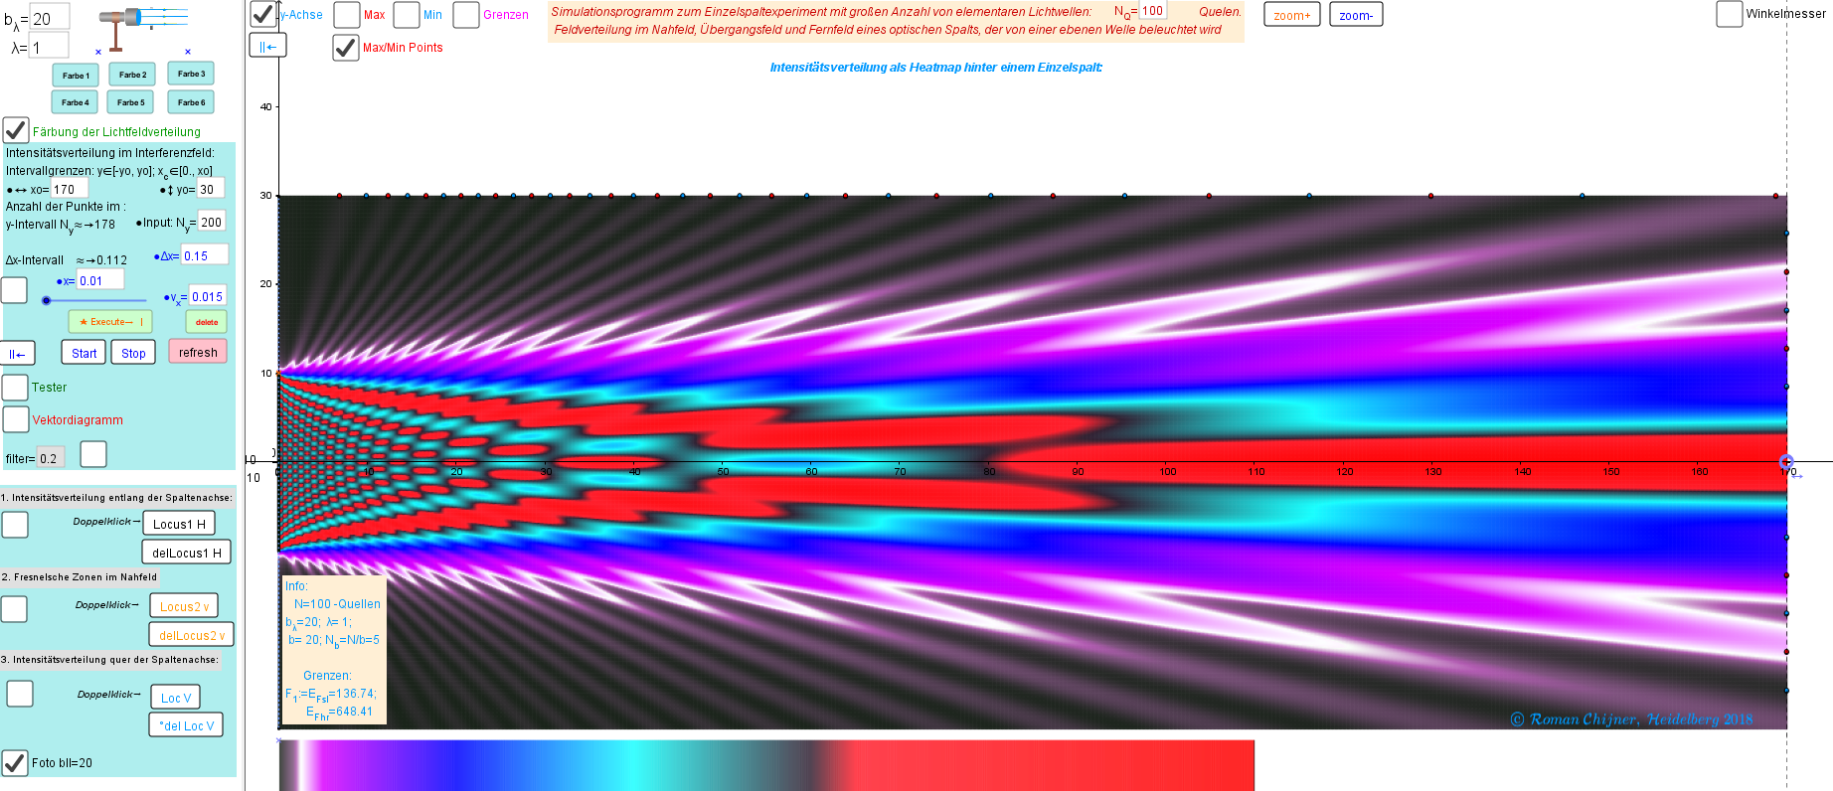
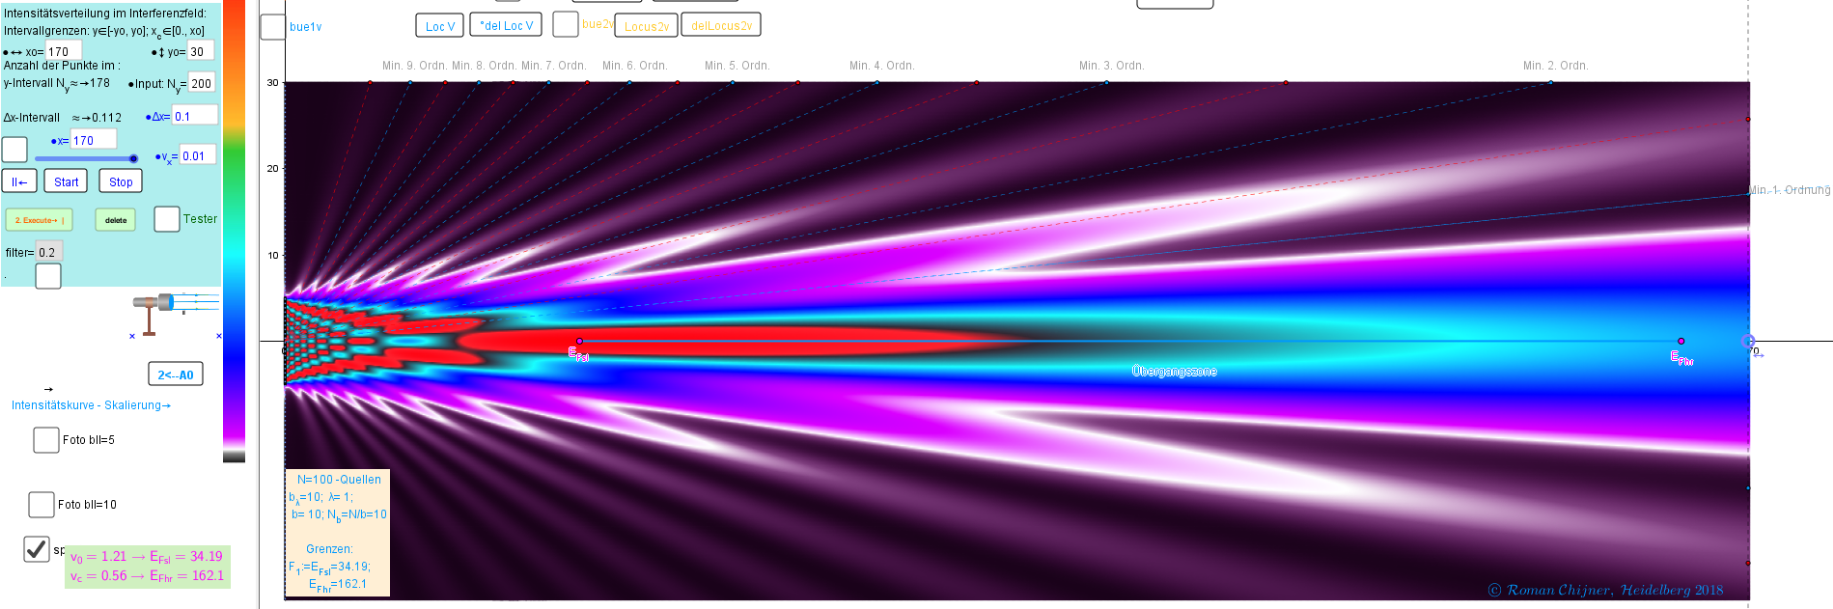
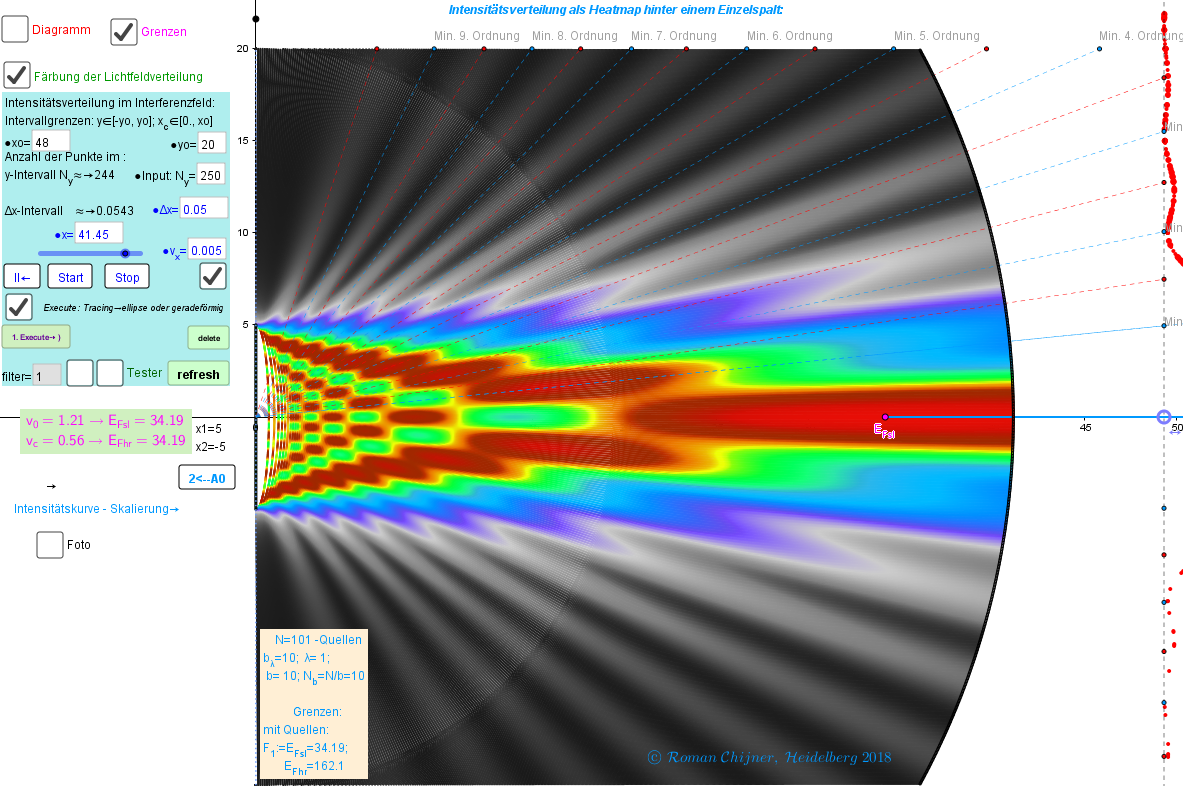
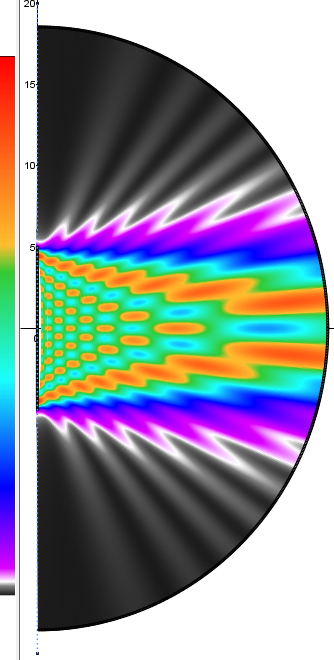
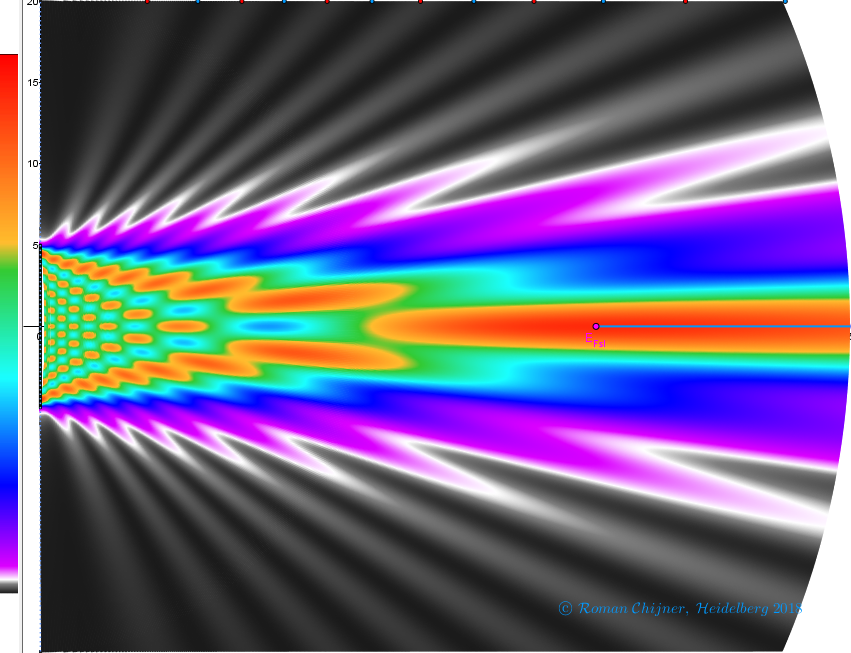
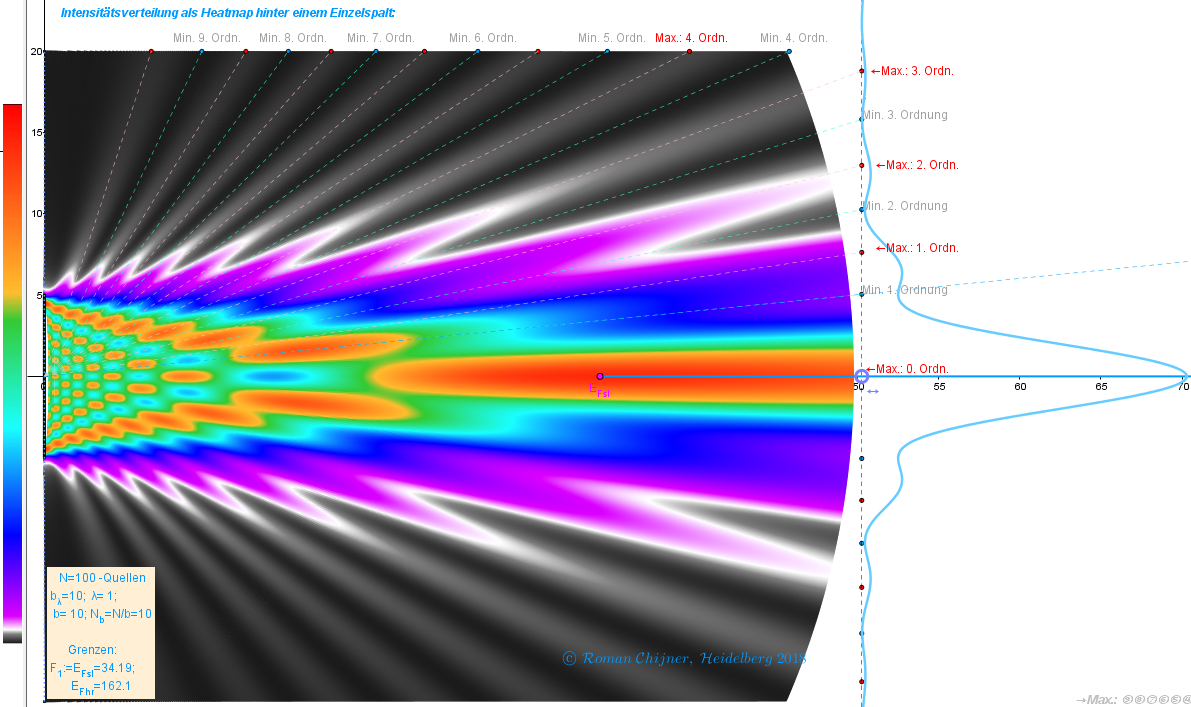
Bilder₂ zum Applet ●Heatmap hinter einem Einzelspalt, die als System von Punktquellen gedämpfter Wellen dargestellt wird.
Autor:
Roman Chijner
Applet:
https://www.geogebra.org/m/dqyhaarg
b_λ=20, Farbe 6, N_Q=200
b_λ=20, Farbe 3, N_Q=200
b_λ=20, Farbe 2, N_Q=200
b_λ=10, Farbe 3, N_Q=200
b_λ=10, Farbe 1, N_Q=100
Neue Materialien
¿Quién llegará más lejos en el mundial?
Nikmati Keunggulan Di Bandar Judi Terpercaya
Viviani's Curve
apec
Hyperbolic Paraboloid
Entdecke Materialien
Top Drawer Teachers: Geometry
Modul 3E_Zalimu_SMA Negeri 2 Baubau
vector assessment
Matrices: 3-d Transformation
Entdecke weitere Themen
Balkendiagramm oder Säulendiagramm
Bestimmtes Integral
Volumen
Vektoren 3D (dreidimensional)
Ebene Figuren