Overzicht
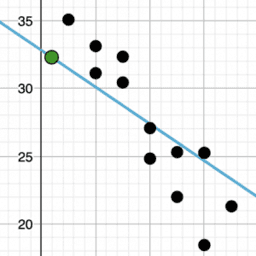
Probability and Statistics 3.5 Trends in scatter plots
These resources have been adapted by MEI from “Describing Trends in Scatter Plots” from IM Grade 8 by Open Up Resources and Illustrative Mathematics. Licensed under the Creative Commons Attribution 4.0 license.