Google Classroom
Google Classroom
GeoGebra
Classe GeoGebra
Se connecter
Chercher
Google Classroom
Google Classroom
GeoGebra
Classe GeoGebra
Contenu
Statistics and probability
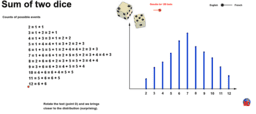
Sum of 2 dices: Did you know this?
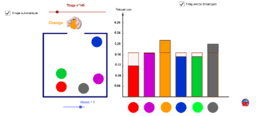
Probability: Drawing of colored balls in an urn
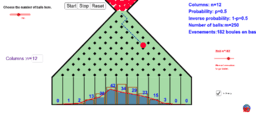
Customizable Galton board
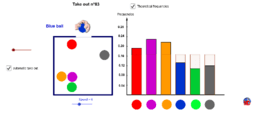
Extraction, Frequencies and Probabilities of a Ballot Box
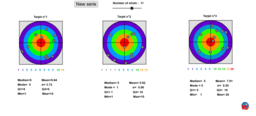
Statistics: compare target shooting series
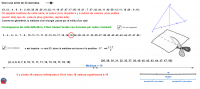
The statistical median: analogy with the geometric median
Diagram of Venn (3 sets)
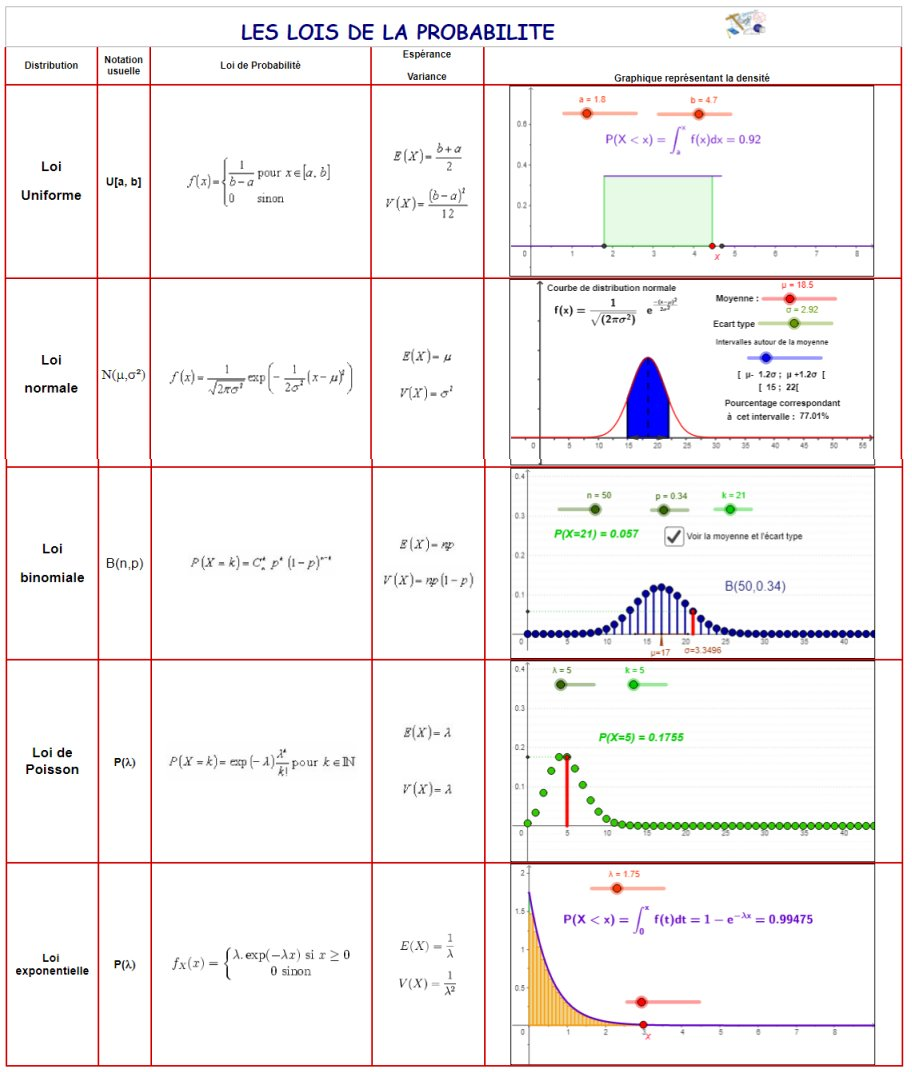
Les lois des probabilités
Dinosaur by statistical calculus (Datasaurus )
Statistics and probability
Auteur :
Daniel Mentrard
Thème :
Arithmétique
,
Diagramme en Barres
,
Loi Binomiale
,
Calcul
,
Combinatoires
,
Probabilité Conditionnelle
,
Intervalle de Confiance
,
Corrélation
,
Distributions
,
Valeur Attendue
,
Moyenne Géométrique
,
Régression Linéaire
,
Moyennes
,
Droite Médiane
,
Valeur Médiane
,
Mode
,
Loi Normale
,
Loi de Poisson
,
Probabilité
,
Expériences Aléatoires
,
Variables Aléatoires
,
Statistiques
,
Variance
Sum of 2 dices: Did you know this?
Probability: Drawing of colored balls in an urn
Customizable Galton board
Extraction, Frequencies and Probabilities of a Ballot Box
Statistics: compare target shooting series
The statistical median: analogy with the geometric median
Diagram of Venn (3 sets)
Les lois des probabilités
Dinosaur by statistical calculus (Datasaurus )
Suivant
Sum of 2 dices: Did you know this?
Nouvelles ressources
Some random function
apec
Angle Addition: Warm Up Exercises
Slope and Road Signs
Model sferyczny - sześcian-ośmiościan
Découvrir des ressources
Game: Space Invasion - multiplying integers
polar intersect
FraccionsA5Artur
Intersection Of Three Planes
Découvrir des Thèmes
Graphe de Fonction
Prisme
Résumé Statistique
Mathématiques
Fonctions Quadratiques