|
| Description | Formula |
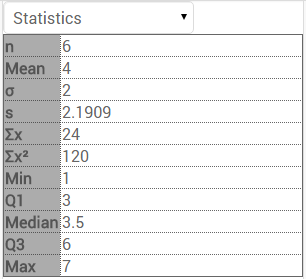
| n | Number of elements | |
| Mean | Calculates the arithmetic mean of the elements. | |
| | Calculates the uncorrected standard deviation of the numbers in the list. | |
| s | Calculates the corrected standard deviation of the numbers in the list. | |
|
| Calculates the Sum of all elements. | |
| | Calculates the Sum of the squares of all elements. |
|
| Min | The minimum represents the lowest value of all numbers. |
| Q1 | Shows the lower (or first) quartile.
Note: The first quartile separates the lowest 25% of data from the highest 75%. |
| Median | The median represents the middle value of a data set.
Note: The median cuts the data set in half. |
| Q3 | Shows the upper (or third) quartile.
Note: The third quartile separates the highest 25% of data from the lowest 75%. |
| Max | The maximum represents the highest value of all numbers.
|