Google Classroom
Google Classroom
GeoGebra
GeoGebra Klaslokaal
Aanmelden
Zoek
Google Classroom
Google Classroom
GeoGebra
GeoGebra Klaslokaal
Overzicht
Statistic Collection and Visualization
Data Collection
Data Intepretation
Statistic Collection and Visualization
Auteur:
Randy Edwards
Onderwerp:
Statistiek
Introduction to Data Collection and Intepretation
Inhoudstafel
Data Collection
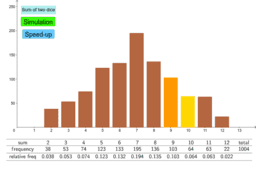
Rolling two dice
Coin Flip Simulation
Data Intepretation
Scatter Slider : Correlation & Line of Best Fit
Normal Distribution: mean, std.dev.
Volgende
Rolling two dice
Nieuw didactisch materiaal
Damped Trochoidal Curve
z`]]
רישום חופשי
Nikmati Keunggulan Di Bandar Judi Terpercaya
Slope and Road Signs
Ontdek materiaal
與一條線段保持固定距離的點的軌跡
Benson_B1_Reflection
Segiempat Konkaf
Untitled
The Tangent Ratio: Introduction
Ontdek onderwerpen
Lineaire vergelijkingen
Volume
Meetkunde
Snijpunt
Afgeleide