Outline
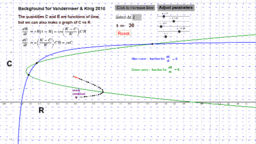
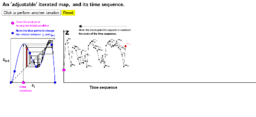
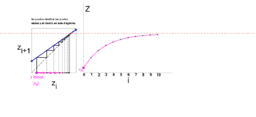
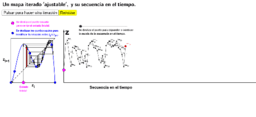
Population Dynamics and nonlinearity
A collection of diagrams to help students visualize population dynamics. To help them visualize nonlinearity in general, see the collections
Iterated Maps for Middle Schoolers (and beyond)
http://www.geogebratube.org/material/show/id/72506
Mapas Iterados: No-linealidad y trayectorias de puntos
http://www.geogebratube.org/material/show/id/72276