Google Classroom
Google Classroom
GeoGebra
GeoGebra Classroom
Abrir sesión
Buscar
Google Classroom
Google Classroom
GeoGebra
GeoGebra Classroom
Esquema
Statistics
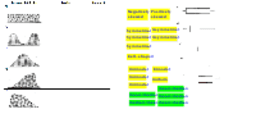
Box & Whisker vs. Histogram
Describing the Distribution (with Box plots)
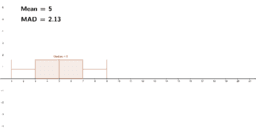
Box Plot Example - MAD
Statistics
Autor:
Roberta Schroeder
Box & Whisker vs. Histogram
Describing the Distribution (with Box plots)
Box Plot Example - MAD
Siguiente
Box & Whisker vs. Histogram
Nuevos recursos
seo tool
Slope Between 2 Points (Phase 2)
Hyperbolic Paraboloid
Viviani's Curve
Nikmati Keunggulan Di Bandar Judi Terpercaya
Descubrir recursos
Distance Between Two Locations
Cross Sections PDF
CanalRectangular1
Exploring Pythagorean Inequality 2
โครงงานแก้ว โมเดลรวม04
Descubre temas
Seno
Romboide
Planos
Hipérbola
Transformaciones Geométricas