Flatten the curve (SIR model & social distancing)
Caution! This app is a bit computation-heavy. If you are using a relatively low-performance PC, it can take a few dozen seconds to load.
Introduction
With this App, you can get a better idea of how pandemics will spread and how we can "flatten the curve".
This simulation is based on the SIR model. Its application isn't limited to any specific disease, but it is actually developed with one disease in mind: Covid-19.
Caveat: This app is intended for educational purposes only, not for serious prediction. (If you think why, please read this).
How to Use
The manipulation of this app is pretty simple and intuitive.
You can play with any item on the screen right now.
(But please be aware of one thing: As it is a bit computation-heavy, it might take several seconds to respond to your input depending on the performance of your PC.)
The following list shows you how to do the typical tasks with this app:
- Choose a country
- Zoom in
- Modify disease parameters
- Simulate social distancing
- Modify initial parameters
Video Walkthrough
Choose a country:
You can choose a country from the "Country" dropdown menu on top of the screen.
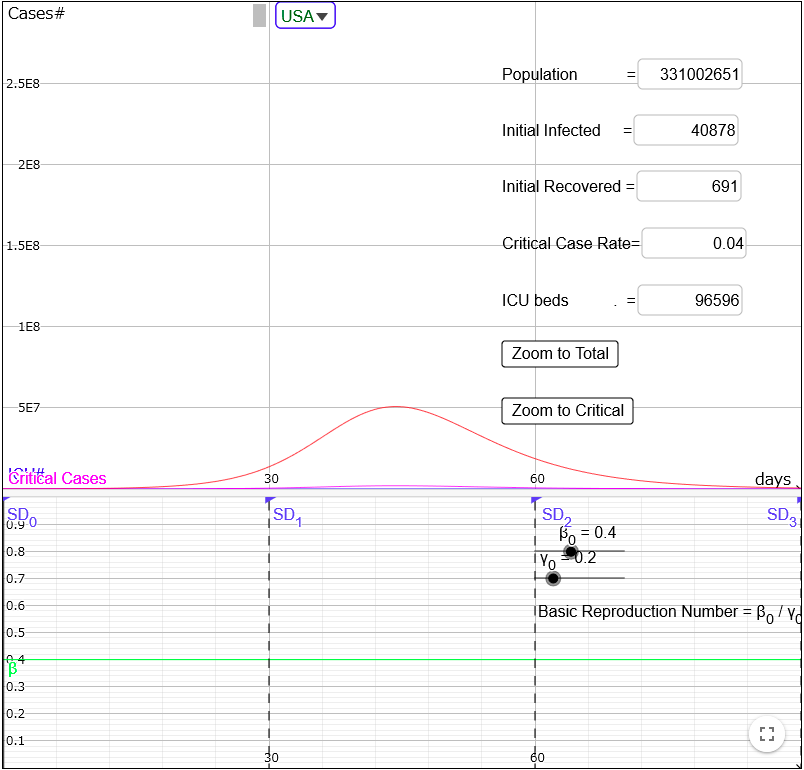
Then all the initial parameter on the right are set and epi curves are drawn based on the parameters automatically.
The X-axis indicates how many days it goes and the Y-axis indicates the number of each type of case (the red curve for the infected cases and the purple curve for the critical cases).
Note: The initial parameters were taken from each country experiencing the Covid-19 pandemic as of 3/29
/2020. The main data source is this site.
Zoom In:
By clicking the "Zoom to Total" button, you can zoom to the red curve indicating the total cases.
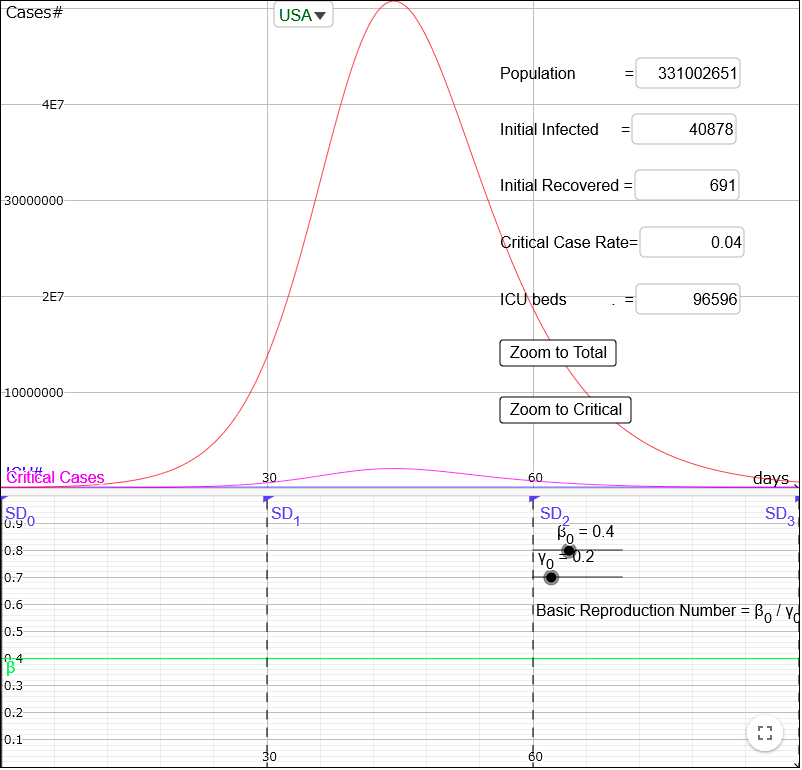
You can also zoom in more to see the purple curve indicating the critical cases only.
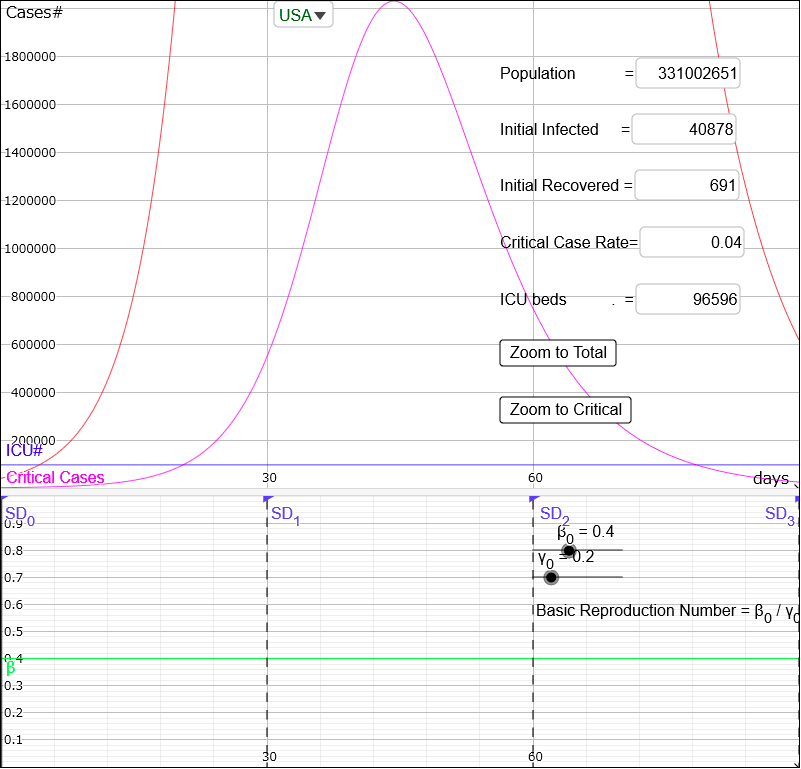
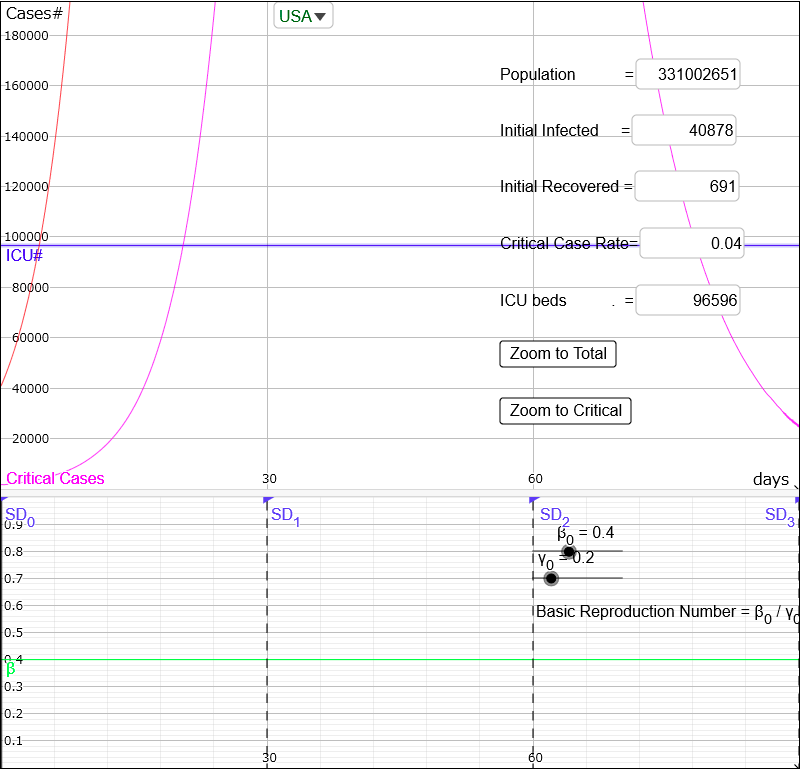
You can also zoom to the horizontal blue line indicating the number of ICU beds by clicking the blue line itself.
Modify disease parameters:
The two sliders on the bottom right of the screen denote disease-specific parameters, which indicate how the disease will spread and subside.
Based on the SIR model, the behavior of the pandemic is determined by only two parameters: and .
determines how quickly the disease will spread. More precisely, how many people an infected person will transmit the disease per day on average.
determines how quickly the disease will subside. More precisely, how many people will recover from the disease per day on average.
is equal to the so-called basic reproduction number () of the disease, theoretically.
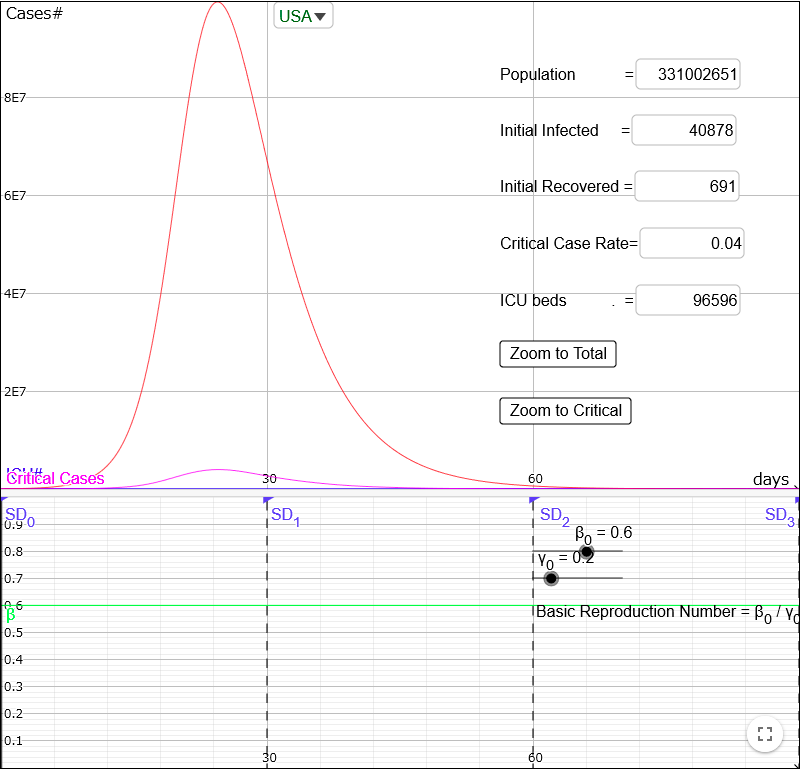
For example, if you increase from 0.4 to 0.6, the disease will spread more quickly and the epi curve will become like this:
Simulate Social Distancing:
In the SIR model, social distancing means reducing the mentioned above.
You can simulate social distancing by directly dragging down the four blue triangles SD0...SD3 on the bottom of the screen.
For example:
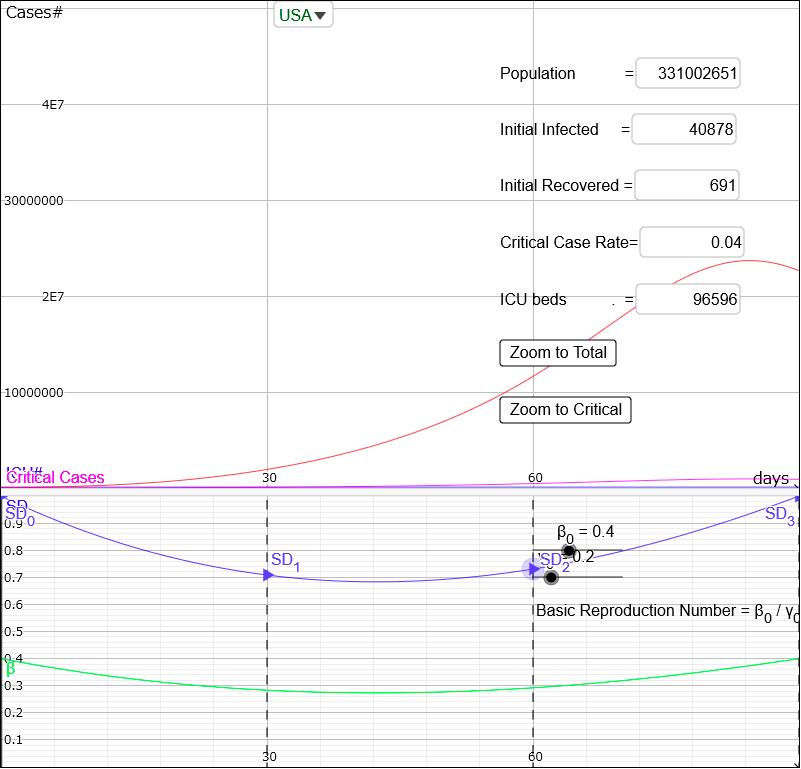
Thanks to the social distancing, the epi curve is a little flattened.
You can also see the green curve on the bottom of the screen is also bent downward.
This green curve shows the actual value on the course of the simulation.
The blue curve (SD) shows how effective the social distancing is, and each Y value of the green curve is multiplied by each Y value of the blue curve.
For example, the value of SD after 30 days is about 0.7, and turns from 0.4 to .
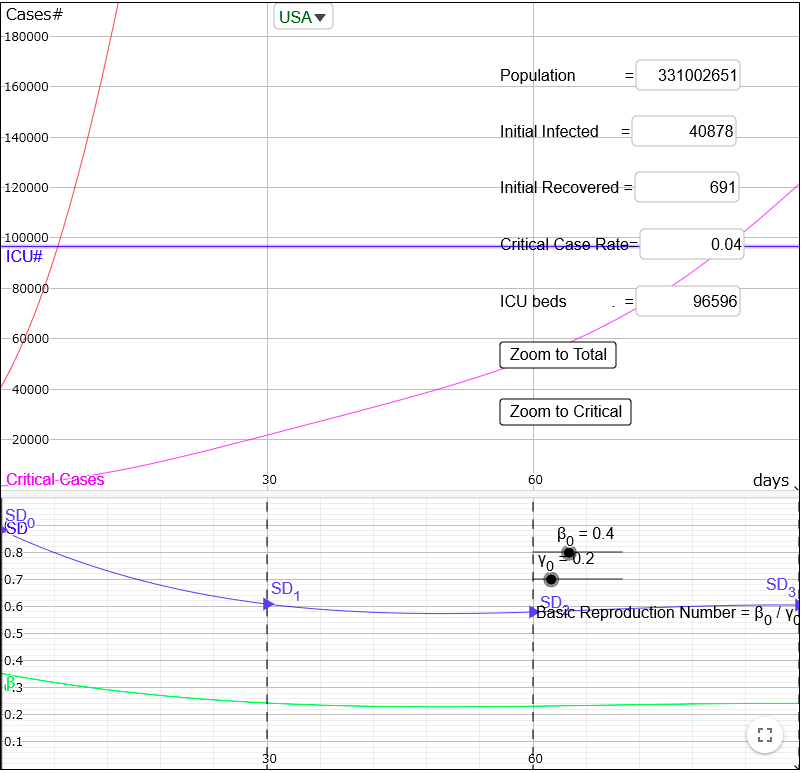
One of the goals of social distancing is to prevent health care systems from being overwhelmed.
So, for example, you can try to reduce the number of critical cases and to prevent it from exceeding the number of ICU beds, like this:
Modify initial parameters:
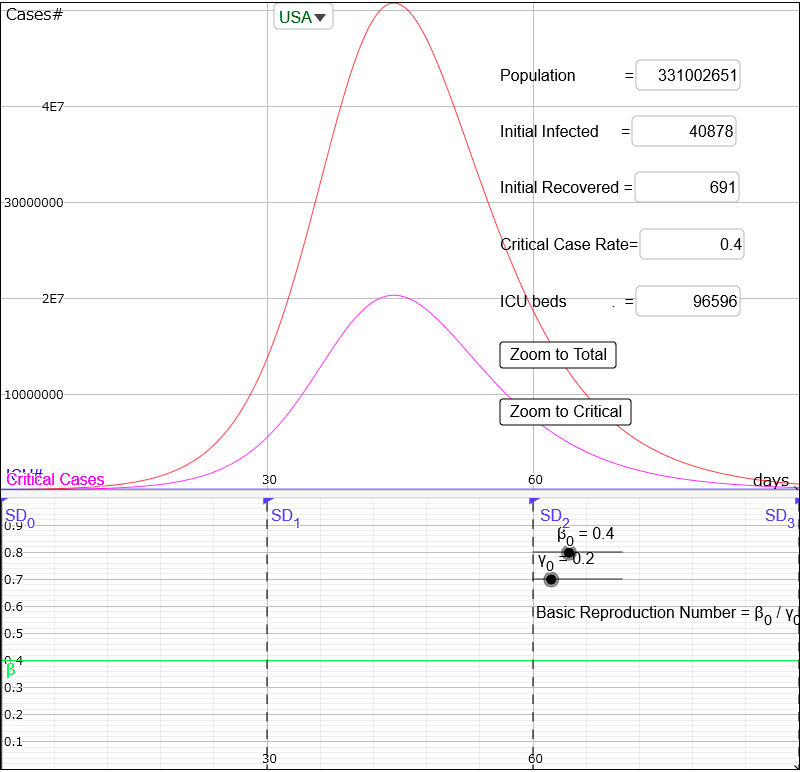
You can also modify the initial parameters individually instead of selecting a country and loading all the parameters at once.
For example, if you think there must be more critical cases, you can modify the "Critical Case Rate" from 0.04 to 0.4, like this:
The model
The SIR model used in this simulation is expressed by the following set of ordinary differential equations:
where:
S: susceptible population
I: infected population
R: recovered population
These equations are solved numerically by using NSolveODE() command of GeoGebra.
SD(t) represents "social distancing" measures and can be any function of t, but in this app, it is determined by interpolating SD0...SD3 using Polynomial() command of GeoGebra:
The estimation of β0 & γ0 of Covid-19
As mentioned above, is equal to the basic reproduction number () of the disease, theoretically.
And researchers have been trying to estimate of Covid-19 in the literature and many studies estimated it to be between 2 and 3. So this app adopts as an initial value.