Google Classroom
Google Classroom
GeoGebra
GeoGebra Classroom
Zaloguj się
Szukaj
Google Classroom
Google Classroom
GeoGebra
GeoGebra Classroom
Zarys
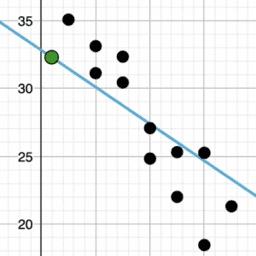
Describing Trends in Scatter Plots: IM 8.6.5
Lesson 8.6.5
Practice 8.6.5
Describing Trends in Scatter Plots: IM 8.6.5
Autor:
GeoGebra Classroom Activities
,
IM 6 – 8 Math
Temat:
Algebra
,
Równania
,
Statystyki
“Describing Trends in Scatter Plots”
from IM Grade 8 by
Open Up Resources
and Illustrative Mathematics. Licensed under the
Creative Commons Attribution 4.0 license
.
Spis treści
Lesson 8.6.5
IM 8.6.5 Lesson: Describing Trends in Scatter Plots
Practice 8.6.5
IM 8.6.5 Practice: Describing Trends in Scatter Plots
Następny
IM 8.6.5 Lesson: Describing Trends in Scatter Plots
Nowe zasoby
apec
Slope and Road Signs
Some random function
Nikmati Keunggulan Di Bandar Judi Terpercaya
רישום חופשי
Odkryj zasoby
Formum_35630_E_UrsprungsFrage
L6 Portfolio (3)
label_2
การแยกตัวประกอบ
HTree
IS flag
Odkryj tematy
Sinus
Wektory 3D (trójwymiarowy)
Kombinatoryka
Współrzędne
Trójkąty