Cerca
Google ClassroomGoogle Classroom
GeoGebraGeoGebra Classroom

Contenuti

  1. Using Diagrams to Represent Addition & Subtraction: IM 6.5.2
    1. Lesson 6.5.2
    2. Practice 6.5.2

    Using Diagrams to Represent Addition & Subtraction: IM 6.5.2

    Autore:GeoGebra Classroom Activities, IM 6 – 8 Math
    Argomento:Addizione, Aritmetica, Diagrammi, Numeri, Sottrazione
    “Using Diagrams to Represent Addition and Subtraction” from IM Grade 6 by Open Up Resources and Illustrative Mathematics. Licensed under the Creative Commons Attribution 4.0 license.
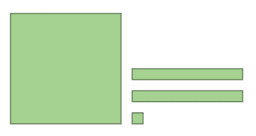
    Using Diagrams to Represent Addition & Subtraction: IM 6.5.2

    Sommario

    • Lesson 6.5.2

      • IM 6.5.2 Lesson: Using Diagrams to Represent Addition and Subtraction
    • Practice 6.5.2

      • IM 6.5.2 Practice: Using Diagrams to Represent Addition and Subtraction
    Successivo
    IM 6.5.2 Lesson: Using Diagrams to Represent Addition and Subtraction

    Nuove risorse

    • Math Art Construction
    • Circles - Relative Positions
    • seo tool
    • Quiz: Vertical Angles and Linear Pairs
    • רישום חופשי

    Scopri le risorse

    • inequalities
    • Matthew Boyer Tad Tomczyk
    • OutilCercle
    • Parallel Lines
    • Midpoint Theorem
    • Burning Tent.

    Scopri gli argomenti

    • Iperbole
    • Quadrilateri
    • Grafici di curve
    • Segmenti
    • Figure o forme piane
    InformazioniPartnerCentro assistenza
    Termini di servizioPrivacyLicenza
    Calcolatrice graficaSuite CalcolatriciRisorse della comunità

    Scarica le nostre app qui:

    Download_on_the_App_Store_Badge_US-UK_RGB_blk_4SVG_092917

    © 2025 GeoGebra®