Google Classroom
Google Classroom
GeoGebra
GeoGebra Classroom
Sign in
Search
Google Classroom
Google Classroom
GeoGebra
GeoGebra Classroom
Outline
AS Statistics
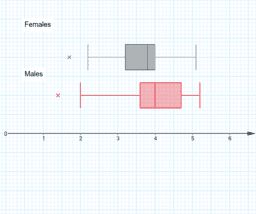
Box plots: page 44, example 3
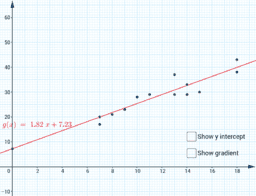
Correlation: page 64, example 3
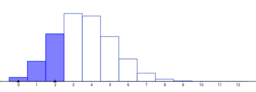
Statistical distributions: page 93, example 7
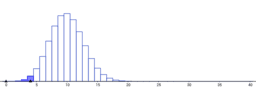
Hypothesis testing: page 103, example 4
AS Statistics
Author:
monicaphillips37
Topic:
Statistics
Box plots: page 44, example 3
Correlation: page 64, example 3
Statistical distributions: page 93, example 7
Hypothesis testing: page 103, example 4
Next
Box plots: page 44, example 3
New Resources
bewijs stelling van Pythagoras
¿Quién llegará más lejos en el mundial?
z`]]
Model sferyczny - sześcian-ośmiościan
Untitled
Discover Resources
Dilation of a vertex 2 a&b
opposite angle in a cyclic quadrilateral
Função Logarítmica
ttt1
SD test
Discover Topics
Boxplot
Means
Standard Deviation
Indefinite Integral
Bar Chart or Bar Graph