Google Classroom
Google Classroom
GeoGebra
GeoGebra Classroom
Sign in
Search
Google Classroom
Google Classroom
GeoGebra
GeoGebra Classroom
Outline
Statistics Demonstrations
Στατιστική Ανάλυση μιας μεταβλητής
Two Variable Statistics
Simulations
Probability Distributions
Randomizers
Other
Confidence Intervals
Statistics Demonstrations
Author:
Kyriacos Mattheou
,
George Sturr
,
Mike May
My copy of George's book. Looking at ability to modify.
Table of Contents
Στατιστική Ανάλυση μιας μεταβλητής
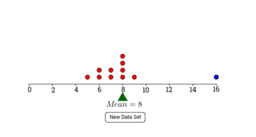
AQR Section 17: Mean but Sensitive
AQR Section 6: Weighted Average Exploration
Εξερευνώντας το Boxplot
AQR Section 17: Where's the Mean?
AQR Section 17: Which Histogram has more Variation?
AQR Section 16: Matching a Pie Chart to a Dot Plot
Two Variable Statistics
Guess the Correlation!
Polynomial Curve Fit
Sampling from a population of ordered pairs
Sensistive r
Least Squares Demonstration
Chi Squared worksheet
Example 3
Simulations
Bag of Marbles
Coin Flip Simulation
Dice Roll Simulation
acertar en la diana - 3
Sampling Distribution of the Mean
The Sampling Distribution
Confidence Interval for a Proportion
The Birthday Paradox Simulation
Probability Distributions
Normal Curve Demonstration
Binomial Distribution with Normal Approximation
Student-t vs. Z
Randomizers
Playing Card Dealer
Create Random Integer Lists
Spinner
Non-transitive Spinners
Flipping 5 Coins
Other
Chaos Game
Confidence Intervals
Proportion Confidence Interval
Mean Confidence Intervals
Finding P-value for proportion
Finding P-value for Sample Mean
Confidence Interval Variation Problems
Confidence Intervals for the Proportion and the Mean
Next
AQR Section 17: Mean but Sensitive
New Resources
r=ασυνκθ
גיליון אלקטרוני להעלאת נתוני בעיה ויצירת גרף בהתאם
apec
Rose Curve
Fourier Lissajous (Mechanical)
Discover Resources
Light, Sound, Motion
quadratic polynomial
Orthogonal
Modul 3_Yuyun Purwanti_SMP N 6 Purwokerto
Exponential functions IB
Discover Topics
Line Segment
Hyperbola
Trigonometric Functions
Angles
Multiplication