UNIT 2 LESSON 1 RATE OF CHANGE
ANALYZING A SCENARIO: COMPLETING A TABLE
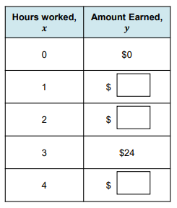
Look at the image above Determine the relationship between the independent variable and the dependent variable. Michaela earns $8 per hour at an after-school job. a) How much would she earn after 1 hour? b) How much would she earn after 2 hours? c) How much would she earn after 4 hours?
What is the domain of the above scenario? Choose one.
What is the range of the above scenario? Choose one.
RATE OF CHANGE FROM A TABLE
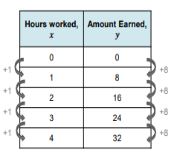
Look at the table above. Michaela earns $8 per hour at an after-school job. Rate of change is the ___________ of the change in the dependent value with respect to the change in the independent value. Rate of change =
GRAPHING A LINEAR FUNCTION
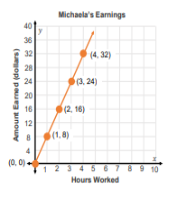
Michaela earns $ 8 per hour at an after-school job. The graph shows the relationship between the number of _________ Michaela works and the amount she ____________.
A linear function describes the relationship between two quantities having a ____________ additive rate of change. The graph of a linear function is a ______________ line.