Search
Google Classroom
GeoGebraGeoGebra Classroom

Outline

  1. Probability and Statistics 1.7 Using histograms
    1. Lesson 1.7
    2. Practice 1.7
    3. Teacher Resources 1.7

    Probability and Statistics 1.7 Using histograms

    Author:MEI KS3 Interactive Resources, IM 6 – 8 Math, GeoGebra Classroom Activities
    These resources have been adapted by MEI from “Using Histograms to Answer Statistical Questions” from IM Grade 6 by Open Up Resources and Illustrative Mathematics. Licensed under the Creative Commons Attribution 4.0 license.
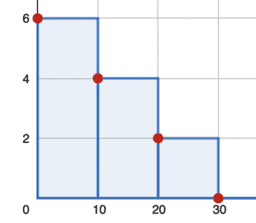
    Probability and Statistics 1.7 Using histograms

    Table of Contents

    • Lesson 1.7

      • Probability and Statistics 1.7 Lesson: Using histograms to answer statistical questions
    • Practice 1.7

      • Probability and Statistics 1.7 Practice: Using histograms to answer statistical questions
    • Teacher Resources 1.7

      • Probabiity and Statistics 1.7
    Next
    Probability and Statistics 1.7 Lesson: Using histograms to answer statistical questions

    New Resources

    • အခြေခံ data အခေါ်အဝေါ်များ
    • Sphere Cylinder & Cone by IIT - Comparison
    • Hyperbola Equation
    • רישום חופשי
    • apec

    Discover Resources

    • dyn_func
    • Untitled
    • Bar Chart or Pie Chart?
    • snowfake9
    • Geometry Week 0 Day 3

    Discover Topics

    • Upper and Lower Sum or Riemann Sum
    • Reflection
    • Linear Equations
    • Algebra
    • Distributions
    AboutPartnersHelp Center
    Terms of ServicePrivacyLicense
    Graphing CalculatorCalculator SuiteMath Resources

    Download our apps here:

    Download_on_the_App_Store_Badge_US-UK_RGB_blk_4SVG_092917

    © 2025 GeoGebra®