Overzicht
AMATYC: Visualizing Solving Equations
Visualizing Solving Equations with Function Mapping Diagrams
AMATYC Webinar
September 22, 2020.
Links: https://flashman.neocities.org/AMATYC/AMATYC.2020.MD.LINKS.html
To have your work recorded and transmitted as part of this webinar
connect to this GeoGebra activity as an interactive GeoGebra class.
Mapping diagrams (MD) are an alternative to cartesian graphs for visualizing functions. The webinar will connect static and dynamic MD's to common function and algebra concepts.
Professor Flashman will show how using MD’s, created with GeoGebra, can empower students to visualize the algebra of solving equations (linear, quadratic, exponential, and trigonometric).
Attendees will have access to a GeoGebra Book with many examples ready for use or modification in their own applications.
Inhoudstafel
Introduction: Backgrounds?
What is a (real) mapping diagram (MD)?
Some Historical Uses of Mapping Diagrams
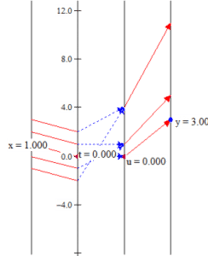
MD to visualize solving linear equations.
MD to visualize solving quadratic equations.
**Optional:MD to visualize solving exponential and logarithmic equations.
**Optional: Mapping diagrams for trigonometric equations
***Optional: MD to visualize complex solutions to quadratic functions and equations.
Summary, Conclusions, References