Google Classroom
Google Classroom
GeoGebra
GeoGebra Classroom
Abrir sesión
Buscar
Google Classroom
Google Classroom
GeoGebra
GeoGebra Classroom
Esquema
Intro to Stats
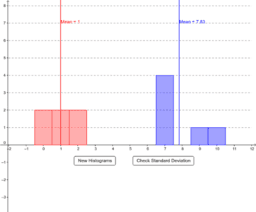
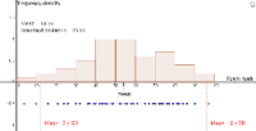
AQR Section 17: Which Histogram has more Variation?
Histograms, mean and standard deviation
Intro to Stats
Autor:
Ms. Melanie Kachinsky
AQR Section 17: Which Histogram has more Variation?
Histograms, mean and standard deviation
Siguiente
AQR Section 17: Which Histogram has more Variation?
Nuevos recursos
z`]]
רישום חופשי
Model sferyczny - sześcian-ośmiościan
Fourier Lissajous (Mechanical)
Model sferyczny - dwunastościan-dwudziestościan
Descubrir recursos
Recta tangente a una Circunferencia en un punto en ella.
create functions
Triangles: Midsegments
Parallelogram #4
การลบจำนวนเต็ม
Αντιγραφή του Angle Copy
Descubre temas
Círculo
Lógica
Diferencia y pendiente
Superficie
Transformaciones Geométricas