概要
MAA Minicourse 2020: Visual Complex Analysis
Visual Complex Analysis- GeoGebra Tools and Mapping Diagrams
https://www.geogebra.org/m/rsqxtq9t
Visualization in complex analysis has been an important aspect to the revitalization of this area in undergraduate programs. The current version of GeoGebra allows dynamic and real time treatment of complex analysis with ease for users that has been available for at least 3 years. In this minicourse the participants will learn how to use GeoGebra and some prepared working activities to visualize all aspects complex analysis.
Note: The example of domain coloring in a previous version has been removed because it took too long to work on some devices.
Dedicated to the memories of David Meredith, Richard Paris, and Jerry Uhl.
Participants will be given access to a GeoGebra Book with examples of the use of Geogebra to visualize key topics from Complex analysis and features of GeoGebra. Presentation will be interactive allowing participants to use, modify, and create their own GeoGebra activities
Another publication with a little bit different approach can be found at: http://ggijro1.files.wordpress.com/2013/10/visualizing_complex_integral_final1.pdf .
目次
Introduction
- JMM Denver Jan. 15 - 18, 2020
- Why GeoGebra for Complex Analysis
- Reference: Quickstart and Classic App Tutorials
- Complex Functions With GeoGebra by Breda & Santos
- Learning GeoGebra by Deconstruction: Composition
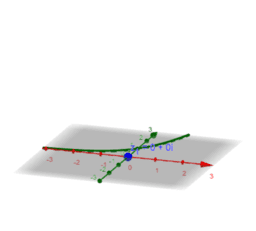
- Complex plane transformations: mapping a line
- Complex Analysis GeoGebra Book By Juan Carlos Ponce Campuzano
- MAA Minicourse Worksheet (pdf)
Part A: Introduction to Mapping Diagrams, Complex Numbers and Complex Arithmetic
Real and Complex Functions
- Real Mapping Diagrams: Tables, Graphs, Realign, Linear Focus
- Complex Mapping Diagram: Source and Target Frames
- Visualizing Real and Imaginary Component Functions
- Complex Functions and Vector Fields
- Table and Mapping Diagram for A Complex Linear Function
- Complex Mapping Diagram: Creating Complex Functions
- Domain coloring- an alternative for visualizing complex functions
Linear and Quadratic Functions and Equations
- Complex Linear Mapping Diagrams I (Circles)
- Complex Linear Mapping Diagram II: f(z) = Az
- Complex Linear Mapping Diagram III (lines)
- Mapping Diagrams for Complex Quadratic Functions & Equations
- Mapping Diagram Solving A Quadratic Equation(Real and Complex)
- Complex Mapping Diagrams for Quadratic Function and Solving Real Quadratic Equations
- Complex Variable Function Mapping Diagrams and Solving Real Cubic Equations
Linear fractional transformations
Mapping Diagrams to Visualize Elementary Functions
Limits and Continuity for Complex Functions
Part B: The derivative, analytic, and meromorphic functions
Complex integration and the Cauchy theorems
Series: Taylor and Laurent
Feedback and References