EPCOR Olympic Graph
Overview:
We looked at the data in this graph step by step. First we just got to know that it was EPCOR and the graph itself. Then we got the x-axis and y-axis and could make some more conjectures about the data. After that, we got the titles of the graph. We could guess the scenario of the graph without knowing the specific writing points on the graph. Lastly, we got to know the entire graph.
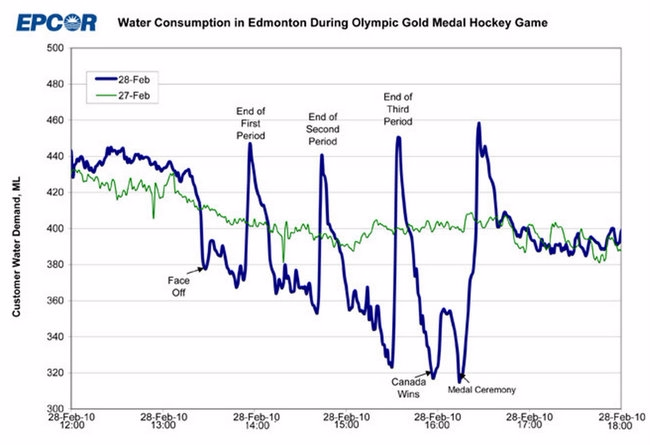
As shown above, this graph allows students to make conjectures step by step by giving students only a piece of the graph. This is important in skill building when given little information about the situation. It teaches student to ask questions which is an important portion of math.
10C
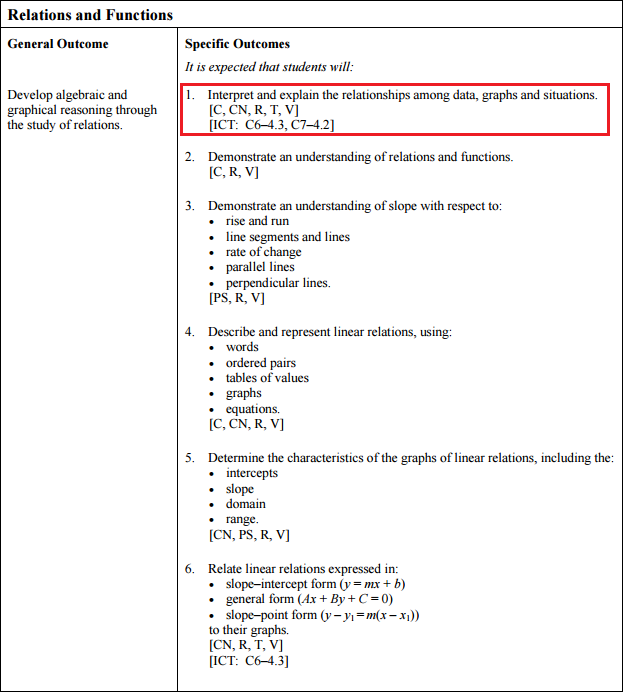
This relates to the Relations and Functions part of the curriculum specifically number 1. Students must look at the graph and slowly make conjectures based on the select and building information that is given to them.
Students must be able to:
- Graph, with or without technology, a set of data, and determine the restrictions on the domainand range.
- Explain why data points should or should not be connected on the graph for a situation.
- Describe a possible situation for a given graph.
- Sketch a possible graph for a given situation.
- Determine, and express in a variety of ways, the domain and range of a graph, a set of
ordered pairs or a table of values.
Sameple Questions
Grade 10:
Give students a graph similar to to the one above and let the students come up with a scenario for the graph. Like we experienced, teachers can take some information off of the graph and slowly show more and more information to the students.
Conclusion:
Overall, I like this way of learning about graphs. I liked that we slowly got to know bits of information so we could make certain conjectures based on the amount of information we were given. I would definitely use this in my classroom as a start to a unit.