Google Classroom
Google Classroom
GeoGebra
GeoGebra Classroom
Anmelden
Suche
Google Classroom
Google Classroom
GeoGebra
GeoGebra Classroom
Kapitel
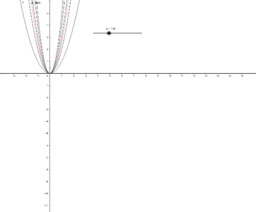
이차함수의 그래프에서 최고차항의 계수와 그래프의 폭의 관계
y=ax^2(a>0)의 그래프
y=ax^2(a<0)의 그래프
y=ax^2의 그래프
이차함수의 그래프에서 최고차항의 계수와 그래프의 폭의 관계
Autor:
rlathgus4582
이차함수의 최고차항의 계수의 절댓값이 클수록 그래프의 폭이 좁아지고 y축에 가까워진다.
Inhaltsverzeichnis
y=ax^2(a>0)의 그래프
이차함수와 그래프의 폭1
y=ax^2(a<0)의 그래프
이차함수와 그래프의 폭2
y=ax^2의 그래프
이차함수와 그래프의 폭3
Weiter
이차함수와 그래프의 폭1
Neue Materialien
뫼비우스의 띠와 클라인 병
이면각
공통수학1_행렬
나머지정리와 인수분해
공통수학1_복소수
Entdecke Materialien
이차방정식과 이차함수
파라볼라
CBSH로고 수정중
와츠(Watts)의 증기기관
벡터의 내적을 넓이로 표현하기1
Entdecke weitere Themen
Inkreis
Strecke
Abschnittsweise definierte Funktionen
Kongruenz und Deckungsgleich
Vektoren 2D (zweidimensional)