Google Classroom
Google Classroom
GeoGebra
GeoGebra Classroom
Abrir sesión
Buscar
Google Classroom
Google Classroom
GeoGebra
GeoGebra Classroom
Esquema
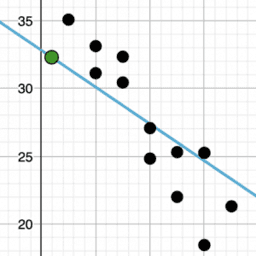
Describing Trends in Scatter Plots
Spot the Odd One out
Some more Practice
Describing Trends in Scatter Plots
Autor:
Lee McCulloch-James
,
IM 6 – 8 Math
,
GeoGebra Classroom Activities
Describing Trends in Scatter Plots Resources[/url] and Illustrative Mathematics. Licensed under the
Creative Commons Attribution 4.0 license
.
Tabla de contenidos
Spot the Odd One out
Describing Trends in Scatter Plots
Some more Practice
Describing Trends in Scatter Plots
Siguiente
Describing Trends in Scatter Plots
Nuevos recursos
Random Polar Curve (3)
Slope Between 2 Points (Phase 2)
Cartesian vs Polar
¿Quién llegará más lejos en el mundial?
Untitled
Descubrir recursos
Net of a Cube
Latitude & Longitude Explorer
Geometry - 1.10 TT
Surface of Revolution: More Vases
Finding the area enclosed by a polar curve
Descubre temas
Triángulos
Gráfico de Barras
Diferencia y pendiente
Círculo
Probabilidad Condicional