Search
Google ClassroomGoogle Classroom
GeoGebraGeoGebra Classroom

Outline

  1. Number 2.7 Using diagrams to represent multiplication
    1. Lesson 2.7
    2. Practice 2.7
    3. Teacher Resources 2.7

    Number 2.7 Using diagrams to represent multiplication

    Author:MEI KS3 Interactive Resources, IM 6 – 8 Math, GeoGebra Classroom Activities
    These resources have been adapted by MEI from “Using Diagrams to Represent Multiplication” from IM Grade 6 by Open Up Resources and Illustrative Mathematics. Licensed under the Creative Commons Attribution 4.0 license.
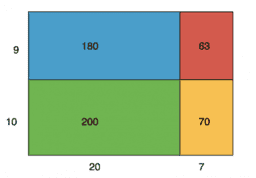
    Number 2.7 Using diagrams to represent multiplication

    Table of Contents

    • Lesson 2.7

      • Number 2.7 Lesson: Using diagrams to represent multiplication
    • Practice 2.7

      • Number 2.7 Practice: Using diagrams to represent multiplication
    • Teacher Resources 2.7

      • Number 2.7
    Next
    Number 2.7 Lesson: Using diagrams to represent multiplication

    New Resources

    • רישום חופשי
    • Traffic Cone
    • Untitled
    • seo tool
    • Level Curves

    Discover Resources

    • Unit 1
    • graph of x^3 and sqrt(x)
    • parallel lines
    • perp bisector
    • triangles with bisectors 11-9-17

    Discover Topics

    • Normal Distribution
    • Quadrilaterals
    • Median Value
    • Isosceles Triangles
    • Equations
    AboutPartnersHelp Center
    Terms of ServicePrivacyLicense
    Graphing CalculatorCalculator SuiteMath Resources

    Download our apps here:

    Download_on_the_App_Store_Badge_US-UK_RGB_blk_4SVG_092917

    © 2025 GeoGebra®