Search
Google ClassroomGoogle Classroom
GeoGebraGeoGebra Classroom

Outline

  1. Using Histograms to Answer Statistical Questions: IM 6.8.7
    1. Lesson 6.8.7
    2. Practice 6.8.7

    Using Histograms to Answer Statistical Questions: IM 6.8.7

    Author:GeoGebra Classroom Activities, IM 6 – 8 Math
    Topic:Histogram, Statistics
    “Using Histograms to Answer Statistical Questions” from IM Grade 6 by Open Up Resources and Illustrative Mathematics. Licensed under the Creative Commons Attribution 4.0 license.
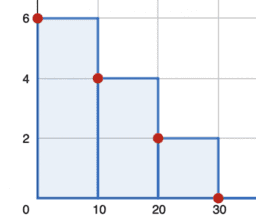
    Using Histograms to Answer Statistical Questions: IM 6.8.7

    Table of Contents

    • Lesson 6.8.7

      • IM 6.8.7 Lesson: Using Histograms to Answer Statistical Questions
    • Practice 6.8.7

      • IM 6.8.7 Practice: Using Histograms to Answer Statistical Questions
    Next
    IM 6.8.7 Lesson: Using Histograms to Answer Statistical Questions

    New Resources

    • Tangent Vector (2)
    • seo tool
    • Parallel Line Image Maker
    • Parallelogram Linkage
    • Sine and Cosine on the Unit Circle

    Discover Resources

    • Cosine - one period
    • jack-of-all-lanterns
    • geometry
    • Work Diagram - Spring (robphy)
    • NRICH 322

    Discover Topics

    • Cube
    • Isosceles Triangles
    • Differential Calculus
    • Vectors 2D (Two-Dimensional)
    • Dilation
    AboutPartnersHelp Center
    Terms of ServicePrivacyLicense
    Graphing CalculatorCalculator SuiteMath Resources

    Download our apps here:

    Download_on_the_App_Store_Badge_US-UK_RGB_blk_4SVG_092917

    © 2025 GeoGebra®