Google Classroom
Google Classroom
GeoGebra
GeoGebra Classroom
Sign in
Search
Google Classroom
Google Classroom
GeoGebra
GeoGebra Classroom
Outline
Graphing for Reflections Practice
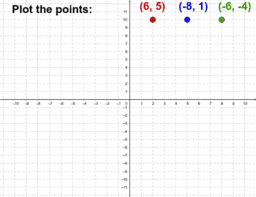
Plot Points
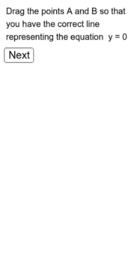
Lines representing equations of the form x = a and y = c
Graphing for Reflections Practice
Author:
Kevin Westrich
Topic:
Reflection
Plot Points
Lines representing equations of the form x = a and y = c
Next
Plot Points
New Resources
Hyperbolic Paraboloid
Nikmati Keunggulan Di Bandar Judi Terpercaya
Damped Trochoidal Curve
Some random function
Cartesian vs Polar
Discover Resources
Congruent Triangles Exploration 4
Law of Sines - Navigation
Investigation of Centres of a Triangle
y=x^2
House
Discover Topics
Differential Equation
Dilation
Difference and Slope
Set Theory
Curve Sketching