DIfferent Kind of Slope

Warm Up

Which graph doesn’t belong?

Cool Down (2 mins_)

Match each diagram to the function described, then label the axes appropriately

  1. The function inputs the age of an oak tree a and outputs a prediction of the height of the tree h.
  2. The function inputs the edge length e of a cube and outputs the volume v.
  3. The function inputs the distance traveled d and predicts the amount of fuel left in the tank f.
  4. The function inputs the height hof a triangle with base 12 and outputs the area a.
  5. The function inputs the time of day t and predicts the temperature T.
  6. The function inputs the time of day t and predicts the number of cars washed at a student car wash c.

The graph shows the temperature between noon and midnight in one day in a certain city.

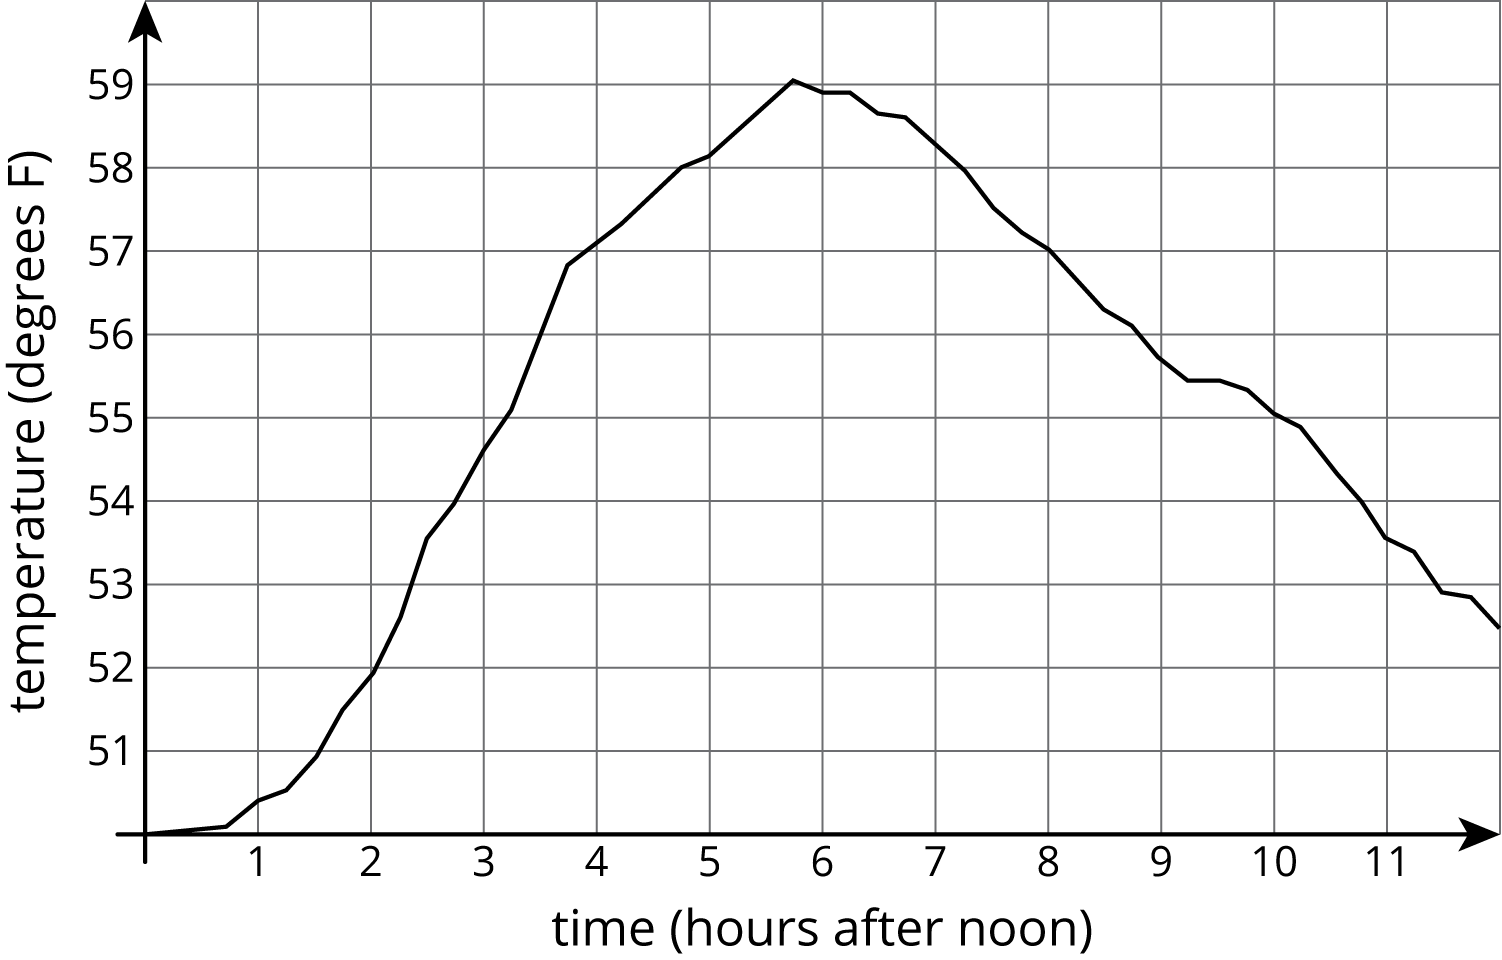
  1. Was it warmer at 3:00 p.m. or 9:00 p.m.?
  2. Approximately when was the temperature highest?
  3. Find another time that the temperature was the same as it was at 4:00 p.m.
  4. Did the temperature change more between 1:00 p.m. and 3:00 p.m. or between 3:00 p.m. and 5:00 p.m.?
  5. Does this graph show that temperature is a function of time, or time is a function of temperature?
  6. When the input for the function is 8, what is the output? What does that tell you about the time and temperature?