Functions, Linear Equations and Proportional Figures
Warm Up ~ Non Graded
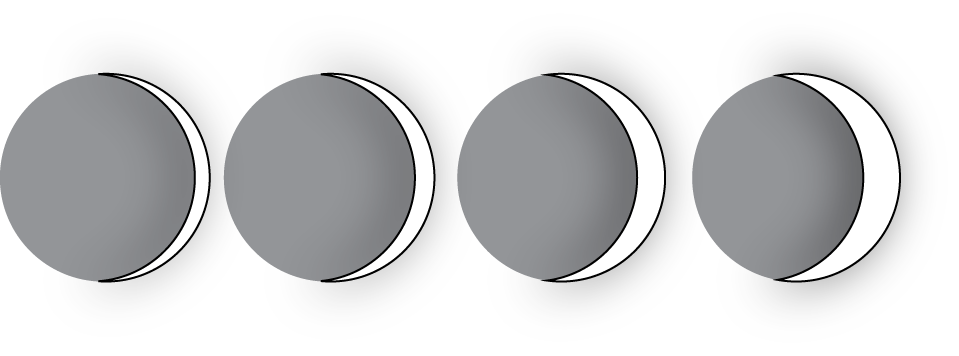 On the first day after the new moon, 2% of the moon's surface is illuminated. On the second day, 6% is illuminated.
(Grade 4, Unit 1; Geometery) How can you find the area, perimeter and volume of this figure?
Graphing Calculator
How to do these kinds of questions.......
When the sun was directly overhead, the stick had no shadow. After 20 minutes, the shadow was 10.5 cm long. After 60 minutes, it was 26 cm long.
This tool is here for you to use if you choose. To plot a point, type its coordinates. For example, try typing (3,5). To graph a line, type its equation. Try typing y=2x+7. You can delete anything by clicking on the X next to it. (Tool Above)
Use the Linear Functions that we learned. Their will be another unit with Linear Equations coming up, but try your best.
If your class/you don't understand let's watch a quick video explaining Linear Inequalaties
Back to Proportions and Linear Equations
A candle is burning. It starts out 12 inches long. After 1 hour, it is 10 inches long. After 3 hours, it is 5.5 inches long.
This tool is here for you to use if you choose. To plot a point, type its coordinates. For example, try typing (1,2). To graph a line, type its equation. Try typing y=2x−3. You can delete anything by clicking on the X next to it.
TOOL ABOVE
Quick Guide ~ Class Line Projects (this is a resource for the class if they are not understanding slope and this content)
Exit Ticket/Homework
In science class, Jada uses a graduated cylinder with water in it to measure the volume of some marbles. After dropping in 4 marbles so they are all under water, the water in the cylinder is at a height of 10 milliliters. After dropping in 6 marbles so they are all under water, the water in the cylinder is at a height of 11 milliliters.
Homework
For a certain city, the high temperatures (in degrees Celsius) are plotted against the number of days after the new year.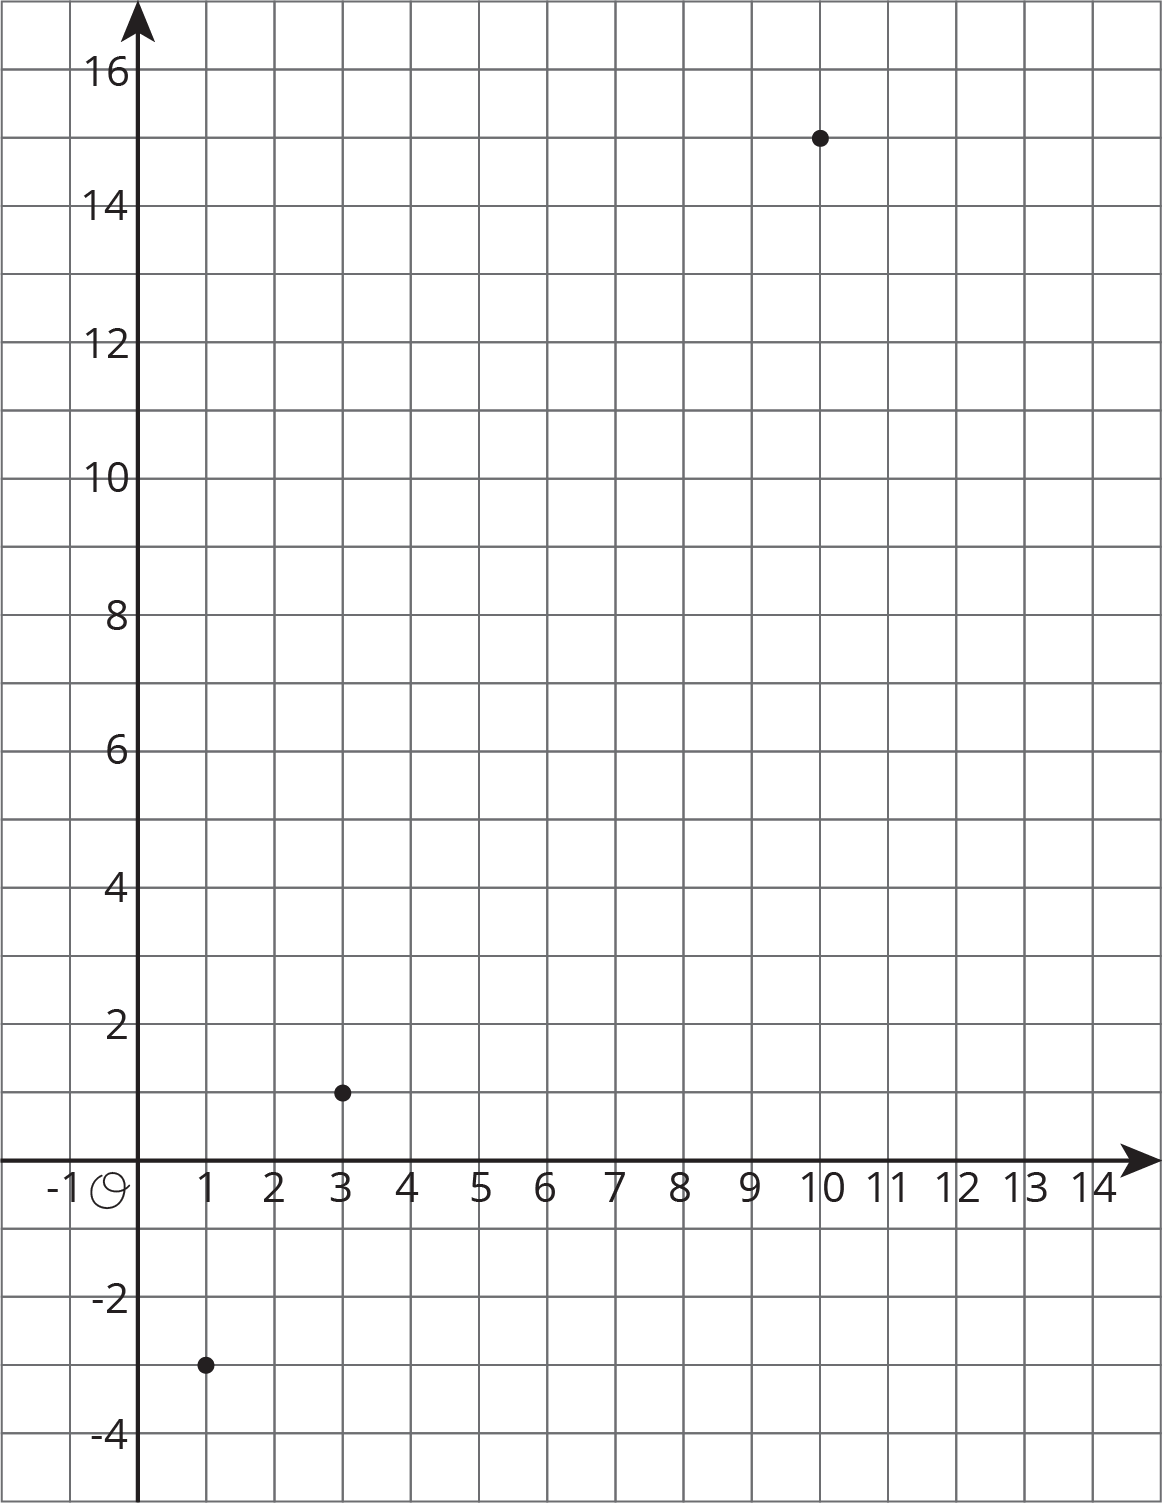 Based on this information, is the high temperature in this city a linear function of the number of days after the new year?