Google Classroom
Google Classroom
GeoGebra
GeoGebra Classroom
Anmelden
Suche
Google Classroom
Google Classroom
GeoGebra
GeoGebra Classroom
Kapitel
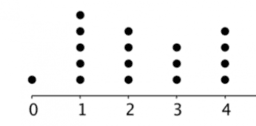
Dot Plots: IM 6.8.4
Lesson 6.8.4
Practice 6.8.4
Dot Plots: IM 6.8.4
Autor:
GeoGebra Classroom Activities
,
IM 6 – 8 Math
Thema:
Statistik
“Dot Plots”
from IM Grade 6 by
Open Up Resources
and Illustrative Mathematics. Licensed under the
Creative Commons Attribution 4.0 license
.
Inhaltsverzeichnis
Lesson 6.8.4
IM 6.8.4 Lesson: Dot Plots
Practice 6.8.4
IM 6.8.4 Practice: Dot Plots
Weiter
IM 6.8.4 Lesson: Dot Plots
Neue Materialien
Damped Trochoidal Curve
Slope and Road Signs
Some random function
bewijs stelling van Pythagoras
Model sferyczny - dwunastościan-dwudziestościan
Entdecke Materialien
Theorems on cyclic quadrilaterals
C3 Q10 Haf 2009 CBAC
Tâche de construction
Modul 3 (Pembuktian Segitiga)_Muhammad Arfiyadi Ahsan_SDN Belitung Utara 1
linktest
Entdecke weitere Themen
Arithmetik
Zylinder
Matrizen
Multiplikation
Zinsrechnung