Drag the Line
Exercises with "Drag the line"
Drag the axis of symmetry, drag the Asymptote, ... You can think of many exercises in which a Line has to be drawn. In next applet a graph of a function of first degree has to be drawn. This is particularly interesting since it focusses on the difference between a line and a linear function. Although graphically they look the same, in GeoGebra they are objects of a different category. We can only compare lines with lines and that's what we will do.
Watch in next applet how it works and then try it yourself following the Construction Steps.
Construction Steps
| 1 | | Type the command lista = Shuffle[{-2,-1,1,2}] to create a list. |
| 2 | | Type the command a = lista(1) to define a number a. |
| 3 | | Type the command b = RandomBetween[-3, 3] to define a number b. |
| 4 | | Type the command f(x) = Polynomial[a x + b] to define a function f. note 1: This command prevents the equation to show as e.g. 1x + 2. note 2: Type a space between a and x. |
| 5 | | Type the command sol = a x + b to define a line sol. This is the line we will compare with de drawn line. |
| 6 | | Type the command A = (-6, -5) to define a point A. |
| 7 | | Type the command B = (-4, -5) to define a point B. |
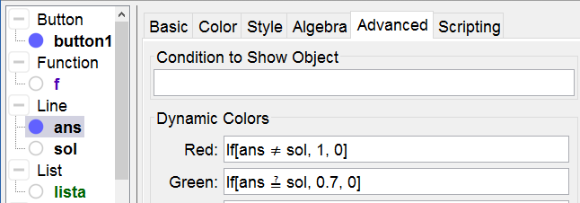
| 8 | | Type the command ans = Line[A, B] to define a line throug A and B. Rightclick on the two points and the line to define their dynamic colors (see below). |
| 9 |  | Select the Button Tool with label next exercise and scripting commands UpdateConstruction[] to recalculate the random numbers SetValue[A,(-6,-5)] SetValue[B,(-4,-5)] to set back the points A and B |
| 10 |  | Select the Text Tool and type the dynamix text: Draw the graph of f(x) = f by dragging the red points. When the answer is correct points and line color green. Select f in the list of available objects. |