Google Classroom
Google Classroom
GeoGebra
Classe GeoGebra
Se connecter
Chercher
Google Classroom
Google Classroom
GeoGebra
Classe GeoGebra
Contenu
M5: 14 Daten
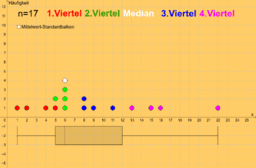
Boxplot: Datenaufteilung in Farbe
M5: 14 Daten
Auteur :
Matthias Hornof
Boxplot: Datenaufteilung in Farbe
Suivant
Boxplot: Datenaufteilung in Farbe
Nouvelles ressources
Grafische Herleitung der 3. Binomischen Formel
Funktion gesucht!
Alles der Steigung nach - Level 1
Die drei Gesichter der homogen linearen Funktion (Wertetabelle, Funktionsgleichung, Graph)
Gleitkommadarstellung - Level 2
Découvrir des ressources
Explizite und implizite Darstellung von Funktionen
Kreisfläche: Entwickeln einer Formel
Ableitung von sin(x)
Groteske Kurve
Swerve
Découvrir des Thèmes
Fonctions
Sections Coniques
Nombres Réels
Polygones
Multiplication