Contenu
Phantom Graphs
Phantom graphs use the 3D graphing capability of GeoGebra to show all solutions, both real and complex, to many equations. In general, they will show all solutions to f(x)=c where c ranges over all reals. Explore to find that by extending to complex numbers we can graph the solutions to x^2=-4 and even see that cos(z)=7 actually has a complex solution (an infinite number of them). In all the applets in this book if the point A(a, b, c) is on the phantom graph, then letting x=a+ic and y=b will give values that satisfy the original equation. Note that y=b is the middle value since we are using the x-axis as real and the z-axis as the imaginary axis.
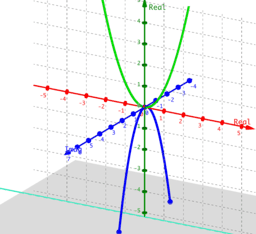
Table des matières
Background and low degree polynomials
Duals: Functions that are PGs of each other when rotated
- Phantom Graph of ellipse is hyperbola (& v.v.)
- Phantom Graph of hyperbola
- Exp, cosine, cosh, sin & sinh are all connected
- Cosine & cosh are PG duals
- Cosh (hyperbolic) and Cos are dual PGs.
- Phantom Graph sine(x)
- Phantom Graph of 1/(1+x^2)
- Phantom Graph of 1/(1-x^2)
- Phantom Graph of 2x^2/(x^2+1)
- Phantom Graph 2x^2/(x^2-1)
- Phantom Graph x^4/(1+x^2)
- Phantom Graph x^4/(1-x^2)
- Phantom Graph (x^2-1)^2
- Phantom Graph (x^2+1)^2
- Phantom Graph cos(x^2/2)
- Phantom Graph cosh(x^2/2)
Exp and sinh: similar but not duals
Howard K.Fehr (1951)!!
Philip Lloyd of New Zealand. All phantom graphs in this chapter come from his notes.
Some Famous Curves
- Phantom Graph Witch of Agnesi
- Phantom Graph Cissoid of Diocles
- Phantom Graph Devil's Curve
- Phantom Graph Tschirnhaus's Cubic
- Phantom Graph Conchoid de Sluze
- Phantom Graph Figure Eight
- Phantom Graph Trisectrix of Maclaurin
- Phantom Graph Serpentine
- Phantom Graph Pear-shaped Quartic
- Phantom Graphs Newton's Diverging Parabolas
- Phantom Graph Kampyle of Eudoxus
- Phantom Graph Strophoid