Google Classroom
Google Classroom
GeoGebra
Classe GeoGebra
Se connecter
Chercher
Google Classroom
Google Classroom
GeoGebra
Classe GeoGebra
Contenu
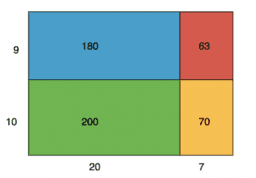
Using Diagrams to Represent Multiplication: IM 6.5.7
Lesson 6.5.7
Practice 6.5.7
Using Diagrams to Represent Multiplication: IM 6.5.7
Auteur :
GeoGebra Classroom Activities
,
IM 6 – 8 Math
Thème :
Arithmétique
,
Diagrammes
,
Multiplication
,
Nombres
“Using Diagrams to Represent Multiplication”
from IM Grade 6 by
Open Up Resources
and Illustrative Mathematics. Licensed under the
Creative Commons Attribution 4.0 license
.
Table des matières
Lesson 6.5.7
IM 6.5.7 Lesson: Using Diagrams to Represent Multiplication
Practice 6.5.7
IM 6.5.7 Practice: Using Diagrams to Represent Multiplication
Suivant
IM 6.5.7 Lesson: Using Diagrams to Represent Multiplication
Nouvelles ressources
Trefoil Knot
Slope Between 2 Points (Phase 2)
רישום חופשי
apec
Rose Curve
Découvrir des ressources
Tricky graphics - Derivative at x=0
Test
Graphing log
Copia de vernier scale for calipers
Is the Butterfly symmetrical?
Découvrir des Thèmes
Hyberbole
Equation Différentielle
Droite Sécante ou Sécante
Entiers Naturels
Limites