Esquema
Phasor diagrams and plots of long power transmission lines
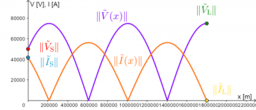
Visualize and customize the phasor diagrams and plots against position (space) of the voltages and currents in long transmission lines (for example, of over 240 km of length at 50 or 60 Hz). The transmission line can be lossy or lossless. The unit prefixes are intended for power systems (kilovolts, for example) but you can also use it for electronic circuits. You can also visualize Ferranti effect in the plot against position when the load is an open circuit.
This book has two chapters: Phasor diagrams (with two apps), and Plots of magnitude against position (considering the source as origin) (with three apps).
It is assumed that you know the series resistance , series inductance , shunt capacitance , and shunt conductance , per unit length of the transmission line, and the length of the transmission line; the cyclic frequency of the system; either the magnitude of the voltage on the load or the magnitude of the voltage on the source, and we take the known voltage as angular reference; resistance and inductance of the load.
The equations were taken from the textbook Líneas de Transmisión (1st edition) [in Spanish] by Rodolfo Neri Vela. The equations were: (2-15), (2-22), (2-35), (2-63), (2-64), (2-68), (2-70).