Google Classroom
Google Classroom
GeoGebra
GeoGebra Classroom
Anmelden
Suche
Google Classroom
Google Classroom
GeoGebra
GeoGebra Classroom
Kapitel
statistics
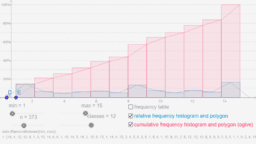
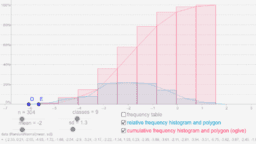
histograms
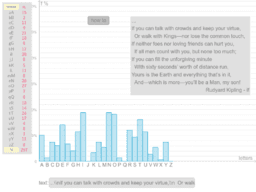
distribution of letters
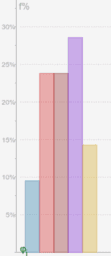
pie chart
Practicing Statistical Calculation-1
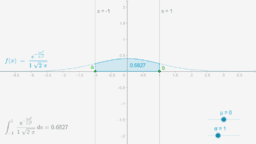
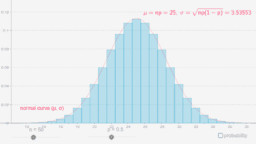
the bell curve
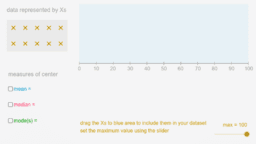
measures of center
pi digits
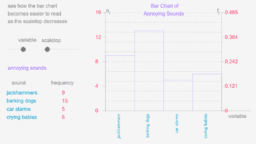
frequency scale
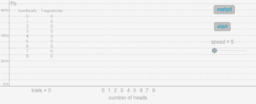
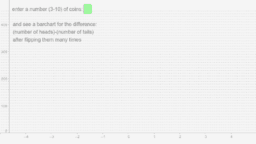
coin flipping-1
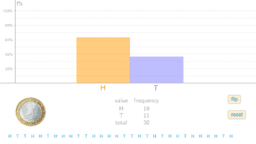
flipping a coin
binomial and normal
random data-1
random data-2
coin tossing simulation
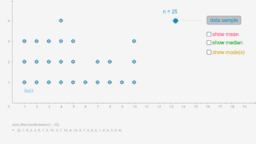
dotplot
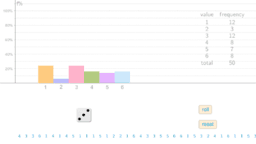
rolling a dice
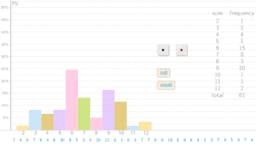
rolling two dice
statistics
Autor:
sonom
Thema:
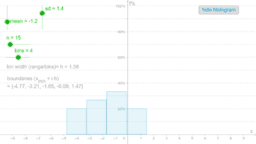
Histogramm
,
Mittelwerte
,
Median
,
Modus
,
Statistik
histograms
distribution of letters
pie chart
Practicing Statistical Calculation-1
the bell curve
measures of center
pi digits
frequency scale
coin flipping-1
flipping a coin
binomial and normal
random data-1
random data-2
coin tossing simulation
dotplot
rolling a dice
rolling two dice
Weiter
histograms
Neue Materialien
Hyperbolic Paraboloid
Damped Trochoidal Curve
အခြေခံ data အခေါ်အဝေါ်များ
¿Quién llegará más lejos en el mundial?
רישום חופשי
Entdecke Materialien
C1 Binomial
NMR 1
Bài tập 3 trang 123
Sphere?
Open Middle (Revamped): Creating Distances in 3 Space
Entdecke weitere Themen
Normalverteilung
Bestimmtes Integral
Folgen und Reihen
Dreiecke
Gleichseitige Dreiecke