Suche
Google ClassroomGoogle Classroom
GeoGebraGeoGebra Classroom
GeoGebra
  • Startseite
  • Materialien
  • Profil
  • Classroom
  • Apps herunterladen

Situação problema: questão 2

Autor:Raiane Lemke

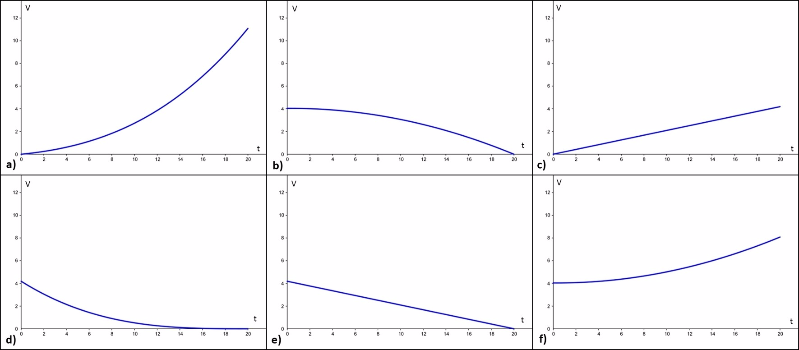
2. Determine qual gráfico representa melhor a variação do volume do balão em relação ao tempo:

Image

Wähle alle richtigen Antworten aus
  • A
  • B
  • C
  • D
  • E
  • F
Antwort überprüfen (3)
Este trabalho está licenciado com uma Licença Creative Commons - Atribuição-NãoComercial 4.0 Internacional.

Neue Materialien

  • Transformação Cubo Dodecaedro
  • Como fazer um gráfico numa região delimitada do GeoGebra
  • teste_aula151024
  • Exemplo de Botão que abre link
  • Determinando a equação da reta por 2 pontos dados

Entdecke Materialien

  • Estudo de transformações simples de funções
  • Trigonometria - Exercício 7
  • olha ai
  • Taxi
  • PIRÂMIDE QUADANGULAR RETA

Entdecke weitere Themen

  • Ableitung oder Differentialquotient
  • Treppenfunktionen
  • Logarithmusfunktionen
  • Sekante
  • Differenzenquotient und Steigung
InfoPartnerHilfe-Center
NutzungsbedingungenPrivatsphäreLizenz
GrafikrechnerRechner SuiteMathe-Materialien

Lade unsere Apps hier herunter:

Download_on_the_App_Store_Badge_US-UK_RGB_blk_4SVG_092917

© 2026 GeoGebra®