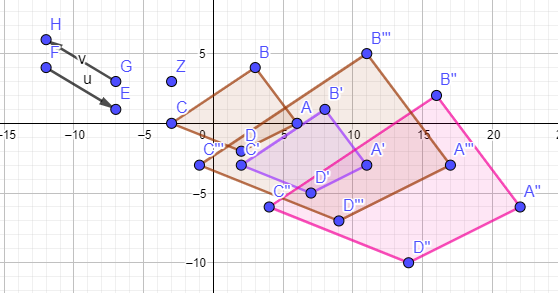
L7.1 Dilation not from the Center - Method 2
Attempt 2 Graph - Directions for this graph is below.
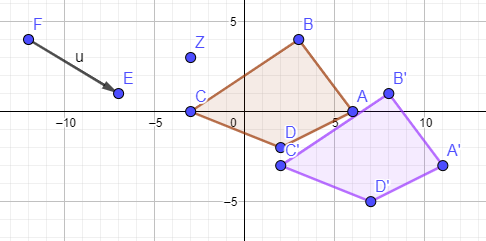
A translation needs to be introduced. PART 1
Copy each point separately - A = (6,0) B = (3,4) C = (-3,0) D = (2,-2) Z = (-5, 3) and paste into the INPUT
Use  Translate Steps:
1. What is the slope from point Z to ORIGIN? Count it out in this specific direction.
2. The first translation needs to be in this direction. To complete the translation, a VECTOR is needed.
To keep the graph less cluttered, we will place the vector else.
3. Plot E & F using the input. E = (-7,1) and F = (-12, 4)
4. Select the vector tool
Translate Steps:
1. What is the slope from point Z to ORIGIN? Count it out in this specific direction.
2. The first translation needs to be in this direction. To complete the translation, a VECTOR is needed.
To keep the graph less cluttered, we will place the vector else.
3. Plot E & F using the input. E = (-7,1) and F = (-12, 4)
4. Select the vector tool . start at F and connect to E.
5. Select the renaming tool
. start at F and connect to E.
5. Select the renaming tool  , click, to name the vector - u
This vector represents the slope between point Z and the ORIGIN.
6. Time to Translate: Copy - Translate( polygon( A, B, C, D ), u ) and paste into the INPUT
7. Change the color of ABCD to purple. The points will be labeled A'B'C'D'
, click, to name the vector - u
This vector represents the slope between point Z and the ORIGIN.
6. Time to Translate: Copy - Translate( polygon( A, B, C, D ), u ) and paste into the INPUT
7. Change the color of ABCD to purple. The points will be labeled A'B'C'D'
Translate Steps:
1. What is the slope from point Z to ORIGIN? Count it out in this specific direction.
2. The first translation needs to be in this direction. To complete the translation, a VECTOR is needed.
To keep the graph less cluttered, we will place the vector else.
3. Plot E & F using the input. E = (-7,1) and F = (-12, 4)
4. Select the vector tool. start at F and connect to E.
5. Select the renaming tool , click, to name the vector - u
This vector represents the slope between point Z and the ORIGIN.
6. Time to Translate: Copy - Translate( polygon( A, B, C, D ), u ) and paste into the INPUT
7. Change the color of ABCD to purple. The points will be labeled A'B'C'D'
A translation needs to be introduced. PART 1
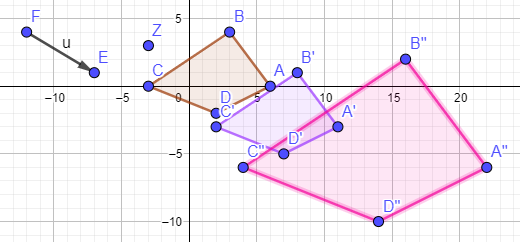
Time to Dilate: PART 2
Copy - Dilate( polygon( A', B', C', D' ), 2 ) and paste into the INPUT -
Change color to pink
Dilation -PART 2
Now Translate Back: PART 3
1. What is the slope from the ORIGIN to point Z?
2. Plot G & H using the input. G = (-7,3) and H = (-12, 6)
3. Select the vector tool. start at G and connect to H.
4. Select the renaming tool to , click, to name the vector - v
5. Copy - Translate( polygon( A'', B'', C'', D'' ), v ) and paste into the INPUT
6. Use to state the IMAGE
. start at G and connect to H.
4. Select the renaming tool to , click, to name the vector - v
5. Copy - Translate( polygon( A'', B'', C'', D'' ), v ) and paste into the INPUT
6. Use to state the IMAGETranslate Back - Part 3