mandelbrot-bifurcation
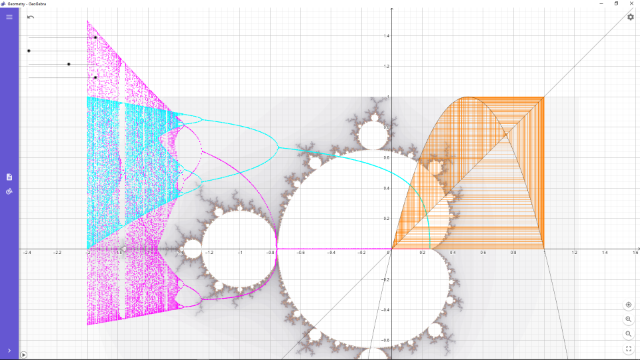
The mandelbrot (along the real axis) matches up with bifurcations of the logistic map.
This demonstrates the connection between the bifurcation diagram of the logistic map (including the cobweb plot) and the mandelbrot fractal. An image was used for the mandelbrot, otherwise it would be too slow to render it in GeoGebra (image generated with Xaos).
Animate the value value of v_0 to obtain images like this (set the range of v_0 from -2 to 4 instead of from 1 to 4 to obtain both sides of the bifurcation diagram):
https://i.imgur.com/S6pqXjX.png