Google Classroom
Google Classroom
GeoGebra
GeoGebra Classroom
Accedi
Cerca
Google Classroom
Google Classroom
GeoGebra
GeoGebra Classroom
Contenuti
Bivariate Data 4D
Spreidingsdiagrammen
Lineaire verbanden
4. Oefeningen
Bivariate Data 4D
Autore:
Arne Timperman
,
Kris Demuynck
Argomento:
Statistica
Spreidingsdiagrammen
Sommario
Spreidingsdiagrammen
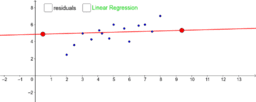
1.3 Trendlijn
Lineaire verbanden
2.2 Correlatiecoëfficiënt
Vergelijken correlatiecoëfficiënt
4. Oefeningen
OEF 4.4 Bungeenjumpen
OEF 4.5 Brandstofverbruik
OEF 4.6 Poolstokspringen
OEF 4.7 ijsproductie
OEF 4.8 Schoenmaat
OEF 4.9 Toetsen
OEF 4.10 Rioleringsgraad afvalwater
OEF 4.11 Franciscus Anscombe
OEF 4.12 Bijen
Oef 46 p 57
Oef 49 p 59
Oef 24 p 45
Oef 26 p 46
Oef 28 p 48
Successivo
1.3 Trendlijn
Nuove risorse
teken en verloop van een reële functie
ingeschreven en omgeschreven figuren
limieten en uitgebreide getallenverzameling
Pythagoras
Yusif ibn Kuseyir mausoleum - paneel boven ingang
Scopri le risorse
Omzetting van oppervlaktematen met keuze.
given intersection xAxis
Give the equation
Driehoeken oplossen (3 zijden gegeven)
Eigenschappen trapezium
Scopri gli argomenti
Poligoni
Parabola
Piramide
Vettori 2D (Due dimensioni)
Punti speciali