Correlation of a Scatter Plot
Drag these points around. What do you notice? What do you wonder about? Enter your noticings and wonderings after the applet.
Enter Observations Here...

Arrange these points so the value of r is as large as possible.
Describe the configuration or pattern of the points that produced the largest value of r you could find. What is this value of r?
Arrange these points on a horizontal line.
What is the value of r when the points are arranged in a horizontal line? What information do you think r is conveying now? Have your changed your mind about what information r is conveying?

The values of r for different scatterplot shapes.
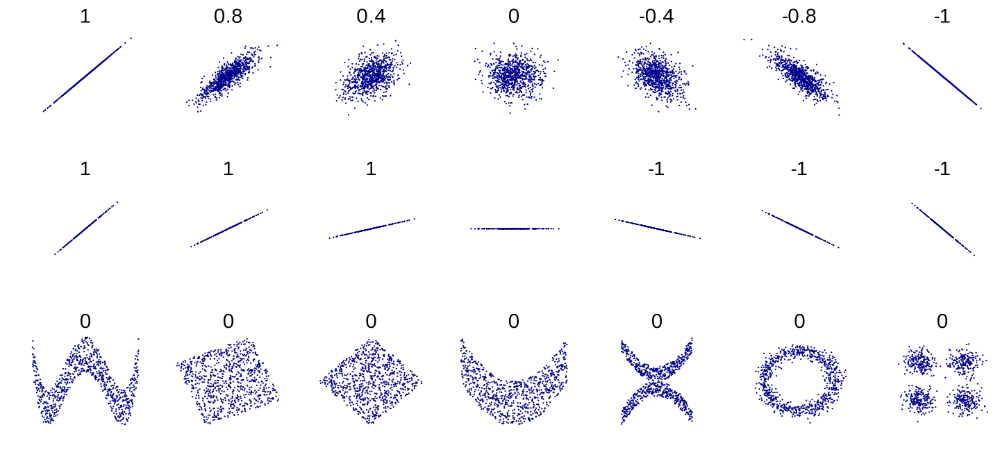
What information is conveyed by the value of r? What do all the patterns in the bottom row have a value of r equal to zero?
What is YOUR definition of r after completing this classroom activity?