Buscar

Esquema

  1. Number 2.2 Use diagrams to represent addition & subtraction
    1. Lesson 2.2
    2. Practice 2.2
    3. Teacher Resources 2.2

    Number 2.2 Use diagrams to represent addition & subtraction

    Autor:MEI KS3 Interactive Resources, IM 6 – 8 Math, GeoGebra Classroom Activities
    These resources have been adapted by MEI from “Using Diagrams to Represent Addition and Subtraction” from IM Grade 6 by Open Up Resources and Illustrative Mathematics. Licensed under the Creative Commons Attribution 4.0 license.
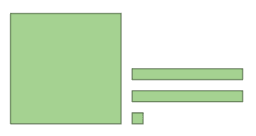
    Number 2.2 Use diagrams to represent addition & subtraction

    Tabla de contenidos

    • Lesson 2.2

      • Number 2.2 Lesson: Use diagrams to represent addition & subtraction
    • Practice 2.2

      • Number 2.2 Practice: Use diagrams to represent addition & subtraction
    • Teacher Resources 2.2

      • Number 2.2
    Siguiente
    Number 2.2 Lesson: Use diagrams to represent addition & subtraction

    Nuevos recursos

    • גיליון אלקטרוני להעלאת נתוני בעיה ויצירת גרף בהתאם
    • רישום חופשי
    • Graphing 1 + cos(θ) in Polar Coordinates
    • Hypocycloids
    • seo tool

    Descubrir recursos

    • Natural Hair Color KAB
    • H Reg Hexagon Const
    • Temp
    • Thin Film Interference
    • Isaac Graph

    Descubre temas

    • Boceto
    • Números Reales
    • Procesos estocásticos o aleatorios
    • Razones
    • Cono
    InformaciónSociosCentro de ayuda
    Condiciones del servicioPrivacidadLicencia
    Calculadora gráficaSuite CalculadoraRecursos matemáticos

    Descarga aquí nuestras aplicaciones:

    Download_on_the_App_Store_Badge_US-UK_RGB_blk_4SVG_092917

    © 2025 GeoGebra®