Buscar
GeoGebra
  • Inicio
  • Recursos
  • Perfil
  • Classroom
  • Descargas

Window "Grafics"

Autor:Horst-Armin Kosog
Image
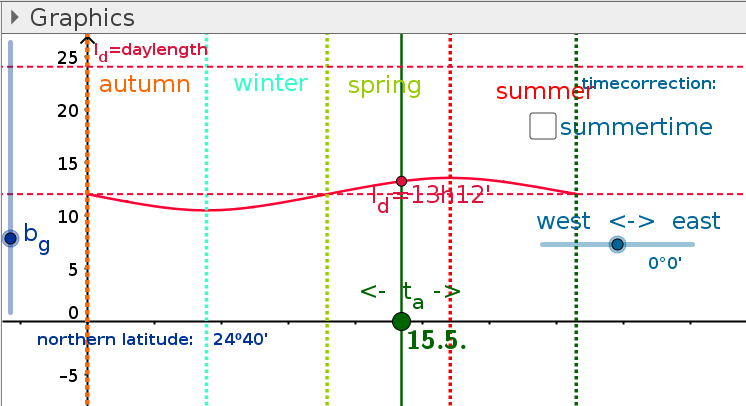
Hereby the daylength is shown as a function of the dato. The dato ta is a point possible to scroll manually and it's also possible to be animated. The slider bg controls northern latitude. (The "timecorrections" are discussed seperately.)

Nuevos recursos

  • Welches Mittelmaß passt am besten?
  • Die drei Gesichter der homogen linearen Funktion (Wertetabelle, Funktionsgleichung, Graph)
  • Prozent & Dezimalzahl ineinander umrechnen
  • Oberfläche einer Kugel - Näherung durch Vielecke
  • Steigung und Steigungsdreieck

Descubrir recursos

  • Satz des Thales
  • Vorlage Berliner Bogen
  • test
  • Rosenkurven
  • Innenwinkelsumme im Dreieck
  • Test1

Descubre temas

  • Segmento Mediana
  • Lógica
  • Logaritmo
  • Homotecia
  • Sucesiones y Series
InformaciónSociosCentro de ayuda
Condiciones del servicioPrivacidadLicencia
Calculadora gráficaSuite CalculadoraRecursos matemáticos

Descarga aquí nuestras aplicaciones:

Download_on_the_App_Store_Badge_US-UK_RGB_blk_4SVG_092917

© 2026 GeoGebra®