Google Classroom
Google Classroom
GeoGebra
GeoGebra Classroom
Abrir sesión
Buscar
Google Classroom
Google Classroom
GeoGebra
GeoGebra Classroom
Esquema
Data Displays
Histogram Worksheet
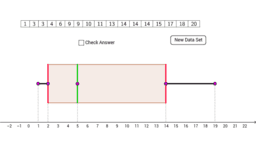
Box Plot
AQR Section 17: Creating a Box and Whisker Plot
Data Displays
Autor:
MsWallaceMath
Collection of data displays resources
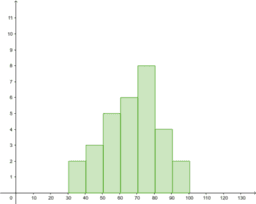
Histogram Worksheet
Box Plot
AQR Section 17: Creating a Box and Whisker Plot
Siguiente
Histogram Worksheet
Nuevos recursos
רישום חופשי
Some random function
apec
z`]]
Rose Curve
Descubrir recursos
Theorem no. 19
Qn 1 reflection
Slope Calculator
凹多邊形的移邊
Untitled
Descubre temas
Función lineal
Cálculo
Intervalo de Confianza
Medias
Sólidos