Google Classroom
Google Classroom
GeoGebra
Classe GeoGebra
Se connecter
Chercher
Google Classroom
Google Classroom
GeoGebra
Classe GeoGebra
Contenu
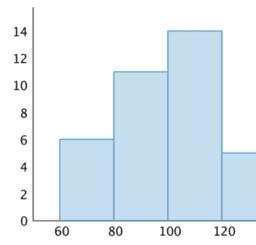
Interpreting Histograms: IM 6.8.6
Lesson 6.8.6
Practice 6.8.6
Interpreting Histograms: IM 6.8.6
Auteur :
GeoGebra Classroom Activities
,
IM 6 – 8 Math
Thème :
Histogramme
,
Statistiques
“Interpreting Histograms”
from IM Grade 6 by
Open Up Resources
and Illustrative Mathematics. Licensed under the
Creative Commons Attribution 4.0 license
.
Table des matières
Lesson 6.8.6
IM 6.8.6 Lesson: Interpreting Histograms
Practice 6.8.6
IM 6.8.6 Practice: Interpreting Histograms
Suivant
IM 6.8.6 Lesson: Interpreting Histograms
Nouvelles ressources
Rose Curve
apec
z`]]
Untitled
အခြေခံ data အခေါ်အဝေါ်များ
Découvrir des ressources
Properties of Translations pd.4
Demonstration of the Pythagorean Theorem?
Linear Algebra
RandvinkelsatsenSTAGG
Exploring Enlargements
Découvrir des Thèmes
Allure de Courbe
Orthocentre
Variance
Rotation
Arbres de Probabilité