Custom Surface of REV in GeoGebra AR: Template
CALCULUS STUDENTS:
A typical problem you're often given is to find the volume of the solid of revolution formed by rotating the area between 2 function graphs about a horizontal axis (y = some number) or vertical axis (x = some number).
Here, you can use GeoGebra Augmented Reality within GeoGebra's 3D Graphing Calculator to CREATE & EXPLORE such a surface of revolution within GeoGebra Augmented Reality!
DIRECTIONS:
1) Open up GeoGebra 3D Graphing Calculator on your non-iOS device that has ARCore by Google
installed on it.
2) Click on the 3 horizontal bars (upper left). Select OPEN.
3) To rotate the area between 2 function graphs about a HORIZONTAL AXIS (y = some number), type in
the code BZWTCPfd. (It IS case sensitive).
To rotate the area between 2 function graphs about a VERTICAL AXIS (x = some number), type in
the code wendqwg7. (It IS case sensitive).
4) Once the resource loads, scroll upwards in the Algebra view (bottom) within this app.
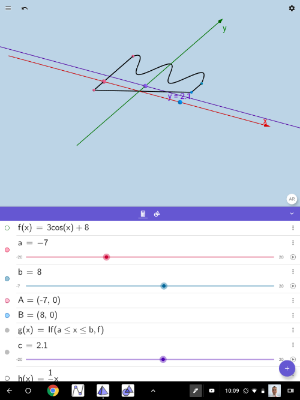
5) The greater (higher) function is f (top most bar). You can modify this. (See pic below).
The lesser (lower) function is h. You can modify this.
a = lower limit of integration (modifiable)
b = upper limit of integration (modifiable).
n = the angle at which you will soon rotate this region (between the 2 graphs) about the line.
c = the y-value of the horizontal line about which you will rotate (if you chose a horizontal axis).
o = the y-value of the vertical line about which you will rotate (if you chose a vertical axis).
s = the shading level of the surface (w/s = 0 being no shade and s = 1 = fully shaded).
Leave the rest of the objects alone, and you'll be all set! Happy exploring!