Search
GeoGebra
  • Home
  • Resources
  • Profile
  • Classroom
  • App Downloads

표본비율의 분포 설명

Author:Kyeongsik Choi
Topic:Distributions
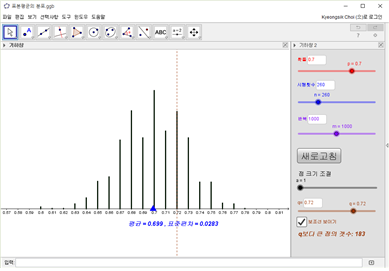
지오지브라에서 만들어진 표본비율 추정 환경에서 다음과 같이 시행횟수를 조절하여 표본비율과 분포가 어떻게 변화하는지 관찰할 수 있다. 예를 들어 다음과 같이 p는 0.7, 시행횟수는 260, 반복은 1000으로 하면 그림과 같은 분포가 나타난다. 
Image

New Resources

  • 행렬의 뜻과 덧셈, 뺄셈, 실수배
  • 복소수의 덧셈과 뺄셈
  • 코사인 그래프의 형성 원리
  • 뫼비우스의 띠와 클라인 병
  • 복소수와 그 연산

Discover Resources

  • 발전기 위상관계 검토
  • 정승7 8/9 HW Q7
  • 조승호[2016수능완성(가)9-23]
  • 도형의 평행이동의 복사본
  • 삼각형의 외접원, 내접원 그리기 프로그램 만들기

Discover Topics

  • Exponential Functions
  • Terms
  • Similar Triangles
  • Line Segment
  • Solids or 3D Shapes
AboutPartnersHelp Center
Terms of ServicePrivacyLicense
Graphing CalculatorCalculator SuiteMath Resources

Download our apps here:

Download_on_the_App_Store_Badge_US-UK_RGB_blk_4SVG_092917

© 2026 GeoGebra®