The Catenary
Introduction
The catenary describes a family of plane curves similar to those that would be generated by a chain suspended by its extremities and subjected to the action of gravity.
Each of these curves is, in fact, the shape assumed by a homogeneous and inextensible chain, fixed to the
extremities, which is subject only to its own weight. The catenary has always fascinated not only mathematicians but also architects and engineers, who have often used it in their works due to its remarkable properties.
Equation and proprieties
The equation of a catenary in Cartesian coordinates has the
where cosh is the hyperbolic cosine function and a is a parameter.
Below there is the Geogebra representation of the catenary graph.
As can be seen:
if a>0, then c is concave upward everywhere,
if a<0, then c is concave downward everywhere.
Use the Geogebra applet below to see catenaries for different values of a>0.
This "rainbow" of catenaries shows us that as the parameter a increases, the curve opens and the vertex ordinate increases (yc flows on the y-axis from bottom to top). Similarly, when the parameter a decreases, the opening of the curve decreases as well as the ordinate of the vertex (yc flows on the y-axis from top to bottom).
Remark. The catenary is a special case of Clinoid.
From the Greek "to incline", the clinoid is a family of plane curves that records the inclination of some phenomenon. The Cartesian equation is the following:
where a,b and c are parameters.
With b = 0 or with c = 0 we have an exponential curve.
With b = c = a / 2 we have a catenary curve.
Below there is a Geogebra representation of the Clinoid family curves:
By moving the selectors we can observe when the exponentials and the catenaries are found between the Clinoid curve family.
Historical aspects
The word "catenary" is derived from the Latin word catēna, which means "chain". We can trace the roots back to one of Leonardo da Vinci's notebooks. Leonardo sketched the shape of a hanging chain, and erroneously asserted that if the supports are not of equal height, then the lowest point of the chain "...will touch the earth nearer to the lower support than to the higher, and in the proportion that the height of the lesser goes into the greater."

From there, a succession of natural philosophers, including Isaac Beeckman, Mersenne, Galileo, Huygens, Pardies, and Hooke ruminated on the shape of the hanging chain and the related problem of the suspension bridge. In particular, Galileo Galilei was the first who systematically studied the catenary problem. On the second day of "Discorsi e dimostrazioni matematiche intorno a due nuove scienze attinenti alla meccanica e i movimenti locali" Galileo identified the shape of a catenary with that of a parabola.
Later this "error" will continue to be unjustly attributed to him by many scientists, including the Huygens and Johann Bernoulli. In reality, on the fourth day of the same opera, Galileo explicitly said that the parabola was an approximation of the catenary and that the two curves, although similar, were actually different. Unfortunately, many famous mathematicians also speak of the "error"of Galileo and attribute to Huygens, Leibniz and Joan Bernoulli the total authorship of the result according to which the two curves are different. Huygens proposed the name of catenary in a letter addressed to Leibniz.
Catenary and Parabola
The association that Galileo made between catenary and parabola is not trivial. There are indeed many links between the two conics. However, it is important to note that they are different curves. Although Galileo spoke of approximation and not of the same curve, he didn't demonstrate the difference between the two. At only 17 years old, Huygens showed in general that catenary and parabola are different curves.
Here, we do not present Huygens' articulated proof, but we propose an empirical proof thanks to Geogebra.
Through the software, in particular, we want to show that, if we take a chain of extremes A and A' of given length l represented by a catenary arc, no parabola passing through A and A' and with length equal to l between A and A' will coincide with the drawn curve.
Geogebra algorithm:
1. Generate a slider a with a variation between -5 and 5.
2. Insert the equation of a catenary with vertex in the origin: c(x) = b*cosh (x / b)-b .
3. Generate a slider b with a variation between -5 and 5.
4. Identify a generic point on the catenary, A=(b, c(b)) and its symmetric A' respect to the y-axis: on the toolbar find the axial symmetry and select A and the y-axis.
5. Calculate the length of the catenary between A and A' typing in the insertion bar: length (c, A', A)
6. Generates a slider d with variation between -5 and 5 and increment 0.001.
7. Write the equation of a family of parabolas with the vertex on the y-axis passing through A and A':
p(x) = (f(b)-d)/ b^2*x^2+d
8. Calculate the length between A and A' of the generic curve of the family typing in the insertion bar: length (p, A', A)
9. Change the parameter c, gradually obtaining all the parabolas of the family, until one identifies it with a length equal to that of the catenary. Visualize that when this happens parabola and catenary are different.
In our daily life many common objects that seem to us parabolas are actually catenaries. An example:
On the second day of "Discorsi e dimostrazioni matematiche intorno a due nuove scienze attinenti alla meccanica e i movimenti locali" Galileo didn't fail completely by identifying the shape of the catenary with that of the parabola. In fact, we can show that for large amplitudes the catenary approximates "well" with a parabola. We use the Geogebra software for this purpose.
Geogebra algorithm:
1. Generate a slider a with a variation interval between -5 to 5 and an increment 0.001.
2. Generate a slider b with a variation interval between -5 and 20 and an increment 0.1.
3. Insert the parabola and the catenary equations with vertex in the origin: p(x) = a*x^2 and
c(x)= b*cosh (x/b)-b.
4. Give a high value to the parameter b, while a small value, but positive, to a.
You will get two curves that, near the origin, almost overlap.
Therefore, holding a catenary suspended for its extremes, if they will be more distant then the drawn curve will resemble a parabola, as Galileo had initially imagined.
Catenary as locus
Case a=1.
Let a = 1, the catenary equation coincides with that of the hyperbolic cosine:
If we consider the exponential curves, and , the middle points of the segments that are joined by the points of the same abscissa belonging to the two exponential curves describe a catenary with vertex (0,1).
General case.
In the case in which the parameter , the catenary can be geometrically described from the parabola.
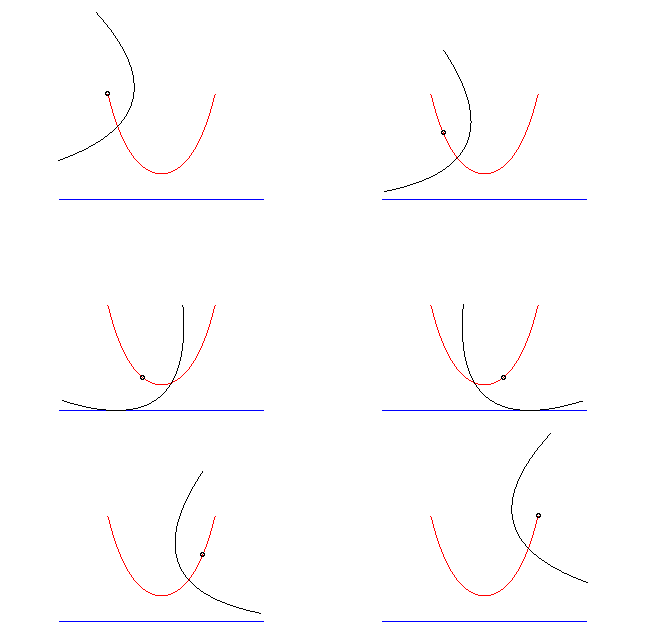
Let the parabola move and rotate along a straight line. The fire of the conic, during this transformation, describes precisely the catenary. It is for this reason that the catenary is called the "roll" of the parabola.
Catenary and square wheel
Can you ride on a square-wheeled bike?
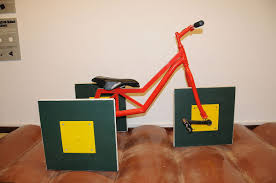
This is the question that many Italian students, in June 2017, had to answer during their final math exam to obtain their high school leaving qualification in Scientific Studies.
EsameDiStatoProvaMatematica2017
Many students got scared and couldn't answer the question and chose the second track of the task.
The answer was instead very simple ... YES!
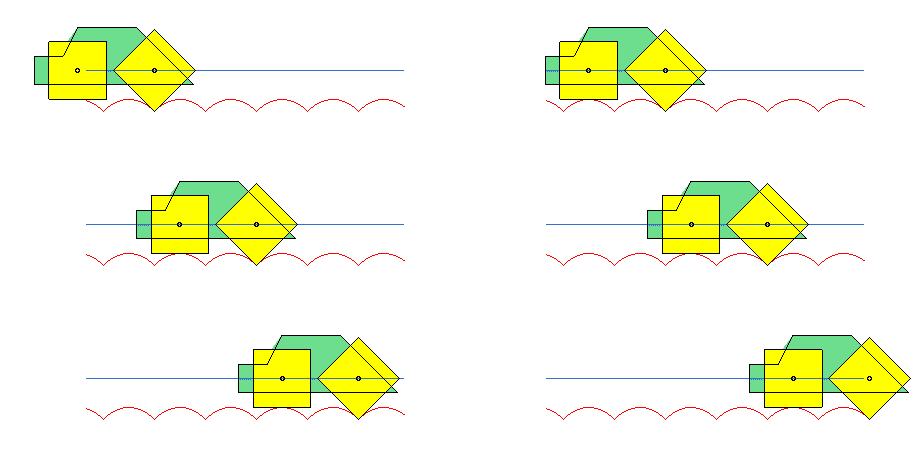
We can ride with a bicycle with square wheels but the road must not be straight but must be formed by catenaries! Look in Geogebra:
Therefore, a bike or a car with square wheels is certainly very useful on surfaces formed by bumps, much more than vehicles with round wheels!
Catenoid
The catenary curve was also studied by the Swiss mathematician Euler. In 1744, he demonstrated that his rotation around the abscissa axis generates a minimal surface, called catenoid.
With Geogebra 3D and using the rotation algorithm around an axis we can visualize this solid:
We can easily build material model of catenoid: just immerse two circles in a soap solution and the shape that takes the surface of the bubble that joins them is a catenoid.
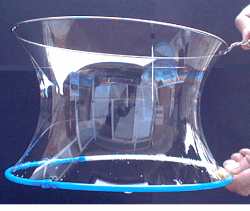
The catenoid has the fascinating property that it can be deformed into a helicoid.
In the next video, Prof. Humberto Bortolossi shows us with GeoGebra RA this isometric transformation:
Catenary, art and architecture
The examples of catenary present in our daily life are very frequent: necklaces without pendants, cables between electricity pylons, arches, bridges.
In particular, if we search on Google for "catenary images", we can recognize this curve in famous architectural works such as the Santa Trinità bridge in Florence, the Church of S. Maria del Fiore by Brunelleschi and the St. Paul's cathedral in London.
The catenary is also very present in the works of Gaudì who identified mathematics as the tool to discover the functionality of the imagined structures.
Many bridges follow the profile of a catenary curve but we must not make the mistake of identifying all them with it ... now that we know it.
For example, the San Francisco Golden Gate Bridge does not have the form of a catenary but the form of a parabola!
With Geogebra we can show that there is no catenary that interpolates the profile of the bridge:
