Quadratic Function

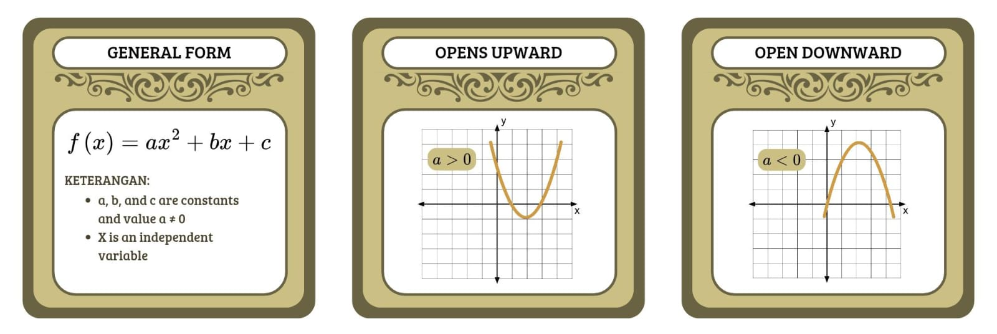
1. Can explain the general form of quadratic functions 2. Can identify the properties of graphs of quadratic functions 3. Can analyze the effect of values a, b, and c 4. Can determine the roots of quadratic functions
![[justify]Have you ever observed the trajectory of a basketball when you push the ball towards the net? The trajectory is parabolic and the ball's motion is said to be parabolic. The image shows the position of the ball at a certain time. Parabolic shapes are found in everyday life.
Parabola is a form of quadratic function in graphs. A quadratic function is a polynomial function (multiple terms) with the highest power of the variable being 2. You still remember linear functions whose graphs are in the form of straight lines. A linear function is a polynomial function with the highest power of the variable being 1.[/justify]](https://www.geogebra.org/resource/dvadusmk/TwhoEdC1EGIGx80S/material-dvadusmk.png)
Have you ever observed the trajectory of a basketball when you push the ball towards the net? The trajectory is parabolic and the ball's motion is said to be parabolic. The image shows the position of the ball at a certain time. Parabolic shapes are found in everyday life. Parabola is a form of quadratic function in graphs. A quadratic function is a polynomial function (multiple terms) with the highest power of the variable being 2. You still remember linear functions whose graphs are in the form of straight lines. A linear function is a polynomial function with the highest power of the variable being 1.
NAME:
CLASS:
Explore the GeoGebra tool provided by observing the changes in the quadratic function graph. Adjust the a, b, and c sliders to see how each value affects the shape of the graph. Notice how changing the value of a affects the width and direction of the parabola, b shifts the vertex left or right, and c determines the y-intercept. Additionally, you can directly enter values for a, b, and c to create a quadratic function graph as desired. Through this exploration, you are expected to understand the relationship between the coefficients in a quadratic equation and the shape of its graph.
After exploring GeoGebra to understand the effect of a, b, and c on quadratic functions, please answer the questions below.
NO.1
What happens to the shape of the graph if the value of a increases or decreases?
NO.2
How does changing the value of b affect the position of the quadratic function graph?
NO. 3
If only c is changed, how will the graph change?
NO.4
If a > 0, what direction does the parabola open? What if a < 0?
NO. 5
Try changing b to zero. What happens to parabolic symmetry?
In this stage, you will answer 10 questions by adjusting the available points. The first step is to find the roots of the equation using the previously learned formula. In the GeoGebra tool below, there is a Start button to begin the exercise. Each question must be solved correctly, and you can check your answer by clicking the See Answer button. Additionally, a Score section is available to display the total points you have collected. To answer, move the five points on the Cartesian coordinate system until they match the quadratic function graph given in the question. Good luck!
LET'S SUMMARIZE !!
After studying quadratic functions, explain their general form and how they differ from linear functions. Describe the properties of the graph, including the shape of the parabola, the axis of symmetry, and the vertex. Analysis of the influence of the coefficients a, b, and c on the graph and how to determine the roots using discriminants. Finally, give an example of the application of the quadratic function in everyday life. Write answers in clear and structured paragraphs.