Search
Google ClassroomGoogle Classroom
GeoGebraGeoGebra Classroom

Outline

  1. Probability and Statistics 1.6 Interpreting histograms
    1. Lesson 1.6
    2. Practice 1.6
    3. Teacher Resources 1.6

    Probability and Statistics 1.6 Interpreting histograms

    Author:MEI KS3 Interactive Resources, IM 6 – 8 Math, GeoGebra Classroom Activities
    These resources have been adapted by MEI from “Interpreting Histograms” from IM Grade 6 by Open Up Resources and Illustrative Mathematics. Licensed under the Creative Commons Attribution 4.0 license.
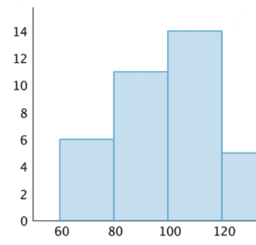
    Probability and Statistics 1.6 Interpreting histograms

    Table of Contents

    • Lesson 1.6

      • Probability and Statistics 1.6 Lesson: Interpreting histograms
    • Practice 1.6

      • Probability and Statistics 1.6 Practice: Interpreting histograms
    • Teacher Resources 1.6

      • Probabiity and Statistics 1.6
    Next
    Probability and Statistics 1.6 Lesson: Interpreting histograms

    New Resources

    • Dilation + Rotation of Pentagons
    • Marion's Theorem
    • Dividing a 2-digit number by a 1-digit number (2)
    • Function Machine
    • Converting Angle Measures Between Degrees and Radians

    Discover Resources

    • geometry 4
    • zmogeliukas
    • Slide 7
    • P2.5

    Discover Topics

    • Cylinder
    • Incircle or Inscribed Circle
    • Cube
    • Median Value
    • Inequalities
    AboutPartnersHelp Center
    Terms of ServicePrivacyLicense
    Graphing CalculatorCalculator SuiteMath Resources

    Download our apps here:

    Download_on_the_App_Store_Badge_US-UK_RGB_blk_4SVG_092917

    © 2025 GeoGebra®