Google Classroom
Google Classroom
GeoGebra
GeoGebra Lesson
Sign in
Search
Google Classroom
Google Classroom
GeoGebra
GeoGebra Lesson
Outline
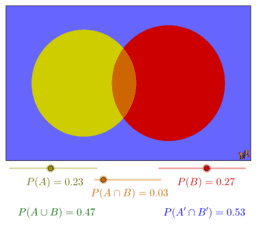
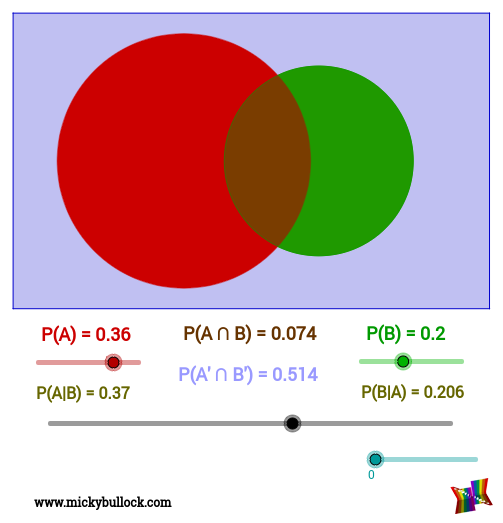
Probability Venn Diagrams
Probability Venn Diagram
Probability Venn Diagram: Circle
Probability Venn Diagram: Rectangle
Probability Venn Diagrams
Author:
Micky Bullock
Topic:
Diagrams
,
Probability
Probability Venn Diagram
Probability Venn Diagram: Circle
Probability Venn Diagram: Rectangle
Next
Probability Venn Diagram
New Resources
Calculating Arc Length, Radius, and Central Angle
Right Triangle Inscribed in a Semicircle
Deriving the Sector Area Formula
Rotating Custom Polygons Around an Axis
繪畫垂直線
Discover Resources
Small angles measured in radians
Refleksi Objek Terhadap Sembarang Persamaan Garis
Construction Project
vector0line1
Interval Notation
Discover Topics
Real Numbers
Upper and Lower Sum or Riemann Sum
Conic Sections
Ratios
Tree Diagrams